Amt Neuhardenberg: Difference between revisions
Appearance
Content deleted Content added
m WP:CHECKWIKI error fix for #03. Missing Reflist. Do general fixes if a problem exists. - |
|||
| (11 intermediate revisions by 3 users not shown) | |||
| Line 1: | Line 1: | ||
'''Neuhardenberg''' is |
'''Amt Neuhardenberg''' is a former ''[[Amt (country subdivision)|Amt]]'' ("collective municipality") in the district of [[Märkisch-Oderland]], in [[Brandenburg]], [[Germany]]. It was disbanded in January 2022.<ref>[https://www.destatis.de/DE/Themen/Laender-Regionen/Regionales/Gemeindeverzeichnis/Namens-Grenz-Aenderung/2022.html Gebietsänderungen vom 01. Januar bis 31. Dezember 2022], [[Statistisches Bundesamt]]</ref> Its seat was in Neuhardenberg. |
||
The ''Amt'' Neuhardenberg |
The ''Amt'' Neuhardenberg consisted of the following municipalities: |
||
#[[Gusow-Platkow]] |
#[[Gusow-Platkow]] |
||
#[[Märkische Höhe]] |
#[[Märkische Höhe]] |
||
| Line 7: | Line 7: | ||
== Demography == |
== Demography == |
||
<gallery widths=" |
<gallery widths="250" heights="200"> |
||
File:Bevölkerungsentwicklung Amt Neuhardenberg.pdf|Development of Population since 1875 within the |
File:Bevölkerungsentwicklung Amt Neuhardenberg.pdf|Development of Population since 1875 within the final boundaries (Blue Line: Population; Dotted Line: Comparison to Population Development of Brandenburg state; Grey Background: Time of Nazi rule; Red Background: Time of Communist rule) |
||
File:Bevölkerungsprognosen Amt Neuhardenberg.pdf|Recent Population Development ( |
File:Bevölkerungsprognosen Amt Neuhardenberg.pdf|Final Population Development and Projections (Population Development before Census 2011 (blue line); Recent Population Development according to the [[Census in Germany]] in 2011 (blue bordered line); Official projections for 2005-2030 (yellow line); for 2017-2030 (scarlet line); for 2020-2030 (green line) |
||
</gallery> |
</gallery> |
||
{{historical populations |
|||
{| |
|||
|align=none | cols=3 | percentages=pagr |
|||
|+style="background:#ffefcf; border: 1pt grey solid;" |'''Amt Neuhardenberg: <br>Population development within the current boundaries (2013)'''<ref>Detailed data sources are to be found in the Wikimedia Commons.[http://commons.wikimedia.org/wiki/Category:Population_projection_Brandenburg Population Projection Brandenburg at Wikimedia Commons]</ref> |
|||
|title = Amt Neuhardenberg: Population development <br>within the final boundaries (2021)<ref>Detailed data sources are to be found in the Wikimedia Commons.[http://commons.wikimedia.org/wiki/Category:Population_projection_Brandenburg Population Projection Brandenburg at Wikimedia Commons]</ref> |
|||
| valign="top" | |
|||
| 1875 | 7789 |
|||
{| class="wikitable" style="border: 1pt grey solid" |
|||
| 1890 | 7099 |
|||
! style="background:#ffefcf;" | Year |
|||
| 1910 | 6066 |
|||
! style="background:#ffefcf;" | Population |
|||
| 1925 | 6097 |
|||
|- |
|||
| 1939 | 5606 |
|||
|style="background:#ffefcf" |1875 || align=right | 7 789 |
|||
| 1950 | 7038 |
|||
|- |
|||
| 1964 | 6129 |
|||
|style="background:#ffefcf" |1890 || align=right | 7 099 |
|||
| 1971 | 6836 |
|||
|- |
|||
| 1981 | 6795 |
|||
|style="background:#ffefcf" |1910 || align=right | 6 066 |
|||
| 1985 | 7020 |
|||
|- |
|||
| 1990 | 6887 |
|||
|style="background:#ffefcf" |1925 || align=right | 6 097 |
|||
| 1995 | 6288 |
|||
|- |
|||
| 2000 | 5314 |
|||
|style="background:#ffefcf" |1933 || align=right | 6 011 |
|||
| 2005 | 4996 |
|||
|- |
|||
| 2010 | 4550 |
|||
|style="background:#ffefcf" |1939 || align=right | 5 606 |
|||
| 2015 | 4513 |
|||
|- |
|||
| 2016 | 4431 |
|||
|style="background:#ffefcf" |1946 || align=right | 6 439 |
|||
| 2017 | 4510 |
|||
|- |
|||
| 2018 | 4571 |
|||
|style="background:#ffefcf" |1950 || align=right | 7 038 |
|||
| 2019 | 4688 |
|||
|- |
|||
| 2020 | 4752 |
|||
|style="background:#ffefcf" |1964 || align=right | 6 129 |
|||
| 2021 | 4753 |
|||
|- |
|||
}} |
|||
|style="background:#ffefcf" |1971 || align=right | 6 836 |
|||
|- |
|||
|} |
|||
| valign="top" | |
|||
{| class="wikitable" style="border: 1pt grey solid" |
|||
! style="background:#ffefcf;" | Year |
|||
! style="background:#ffefcf;" | Population |
|||
|- |
|||
|style="background:#ffefcf" |1981 || align=right | 6 795 |
|||
|- |
|||
|style="background:#ffefcf" |1985 || align=right | 7 020 |
|||
|- |
|||
|style="background:#ffefcf" |1989 || align=right | 6 990 |
|||
|- |
|||
|style="background:#ffefcf" |1990 || align=right | 6 887 |
|||
|- |
|||
|style="background:#ffefcf" |1991 || align=right | 6 673 |
|||
|- |
|||
|style="background:#ffefcf" |1992 || align=right | 6 545 |
|||
|- |
|||
|style="background:#ffefcf" |1993 || align=right | 6 404 |
|||
|- |
|||
|style="background:#ffefcf" |1994 || align=right | 6 390 |
|||
|- |
|||
|style="background:#ffefcf" |1995 || align=right | 6 288 |
|||
|- |
|||
|style="background:#ffefcf" |1996 || align=right | 6 207 |
|||
|- |
|||
|} |
|||
| valign="top" | |
|||
{| class="wikitable" style="border: 1pt grey solid" |
|||
! style="background:#ffefcf;" | Year |
|||
! style="background:#ffefcf;" | Population |
|||
|- |
|||
|style="background:#ffefcf" |1997 || align=right | 5 978 |
|||
|- |
|||
|style="background:#ffefcf" |1998 || align=right | 5 785 |
|||
|- |
|||
|style="background:#ffefcf" |1999 || align=right | 5 548 |
|||
|- |
|||
|style="background:#ffefcf" |2000 || align=right | 5 314 |
|||
|- |
|||
|style="background:#ffefcf" |2001 || align=right | 5 239 |
|||
|- |
|||
|style="background:#ffefcf" |2002 || align=right | 5 230 |
|||
|- |
|||
|style="background:#ffefcf" |2003 || align=right | 5 136 |
|||
|- |
|||
|style="background:#ffefcf" |2004 || align=right | 5 109 |
|||
|- |
|||
|style="background:#ffefcf" |2005 || align=right | 4 996 |
|||
|- |
|||
|style="background:#ffefcf" |2006 || align=right | 4 938 |
|||
|- |
|||
|} |
|||
| valign="top" | |
|||
{| class="wikitable" style="border: 1pt grey solid" |
|||
! style="background:#ffefcf;" | Year |
|||
! style="background:#ffefcf;" | Population |
|||
|- |
|||
|style="background:#ffefcf" |2007 || align=right | 4 873 |
|||
|- |
|||
|style="background:#ffefcf" |2008 || align=right | 4 748 |
|||
|- |
|||
|style="background:#ffefcf" |2009 || align=right | 4 608 |
|||
|- |
|||
|style="background:#ffefcf" |2010 || align=right | 4 550 |
|||
|- |
|||
|style="background:#ffefcf" |2011 || align=right | 4 287 |
|||
|- |
|||
|style="background:#ffefcf" |2012 || align=right | 4 271 |
|||
|- |
|||
|style="background:#ffefcf" |2013 || align=right | 4 275 |
|||
|- |
|||
|style="background:#ffefcf" |2014 || align=right | 4 358 |
|||
|- |
|||
|style="background:#ffefcf" |2015 || align=right | 4 513 |
|||
|- |
|||
|} |
|||
|} |
|||
==References== |
|||
{{Ämter (Brandenburg)}} |
|||
{{Reflist}} |
|||
{{coord|52.600|N|14.250|E|display=title|source:dewiki}} |
|||
{{Authority control}} |
{{Authority control}} |
||
{{Coord|52.592306| 14.266667|display=title|source:wikidata}} |
|||
==References== |
|||
{{Reflist}} |
|||
[[Category:Ämter in Brandenburg]] |
[[Category:Former Ämter in Brandenburg|Neuhardenberg]] |
||
[[Category:Märkisch-Oderland]] |
[[Category:Märkisch-Oderland]] |
||
Latest revision as of 06:17, 11 September 2022
Amt Neuhardenberg is a former Amt ("collective municipality") in the district of Märkisch-Oderland, in Brandenburg, Germany. It was disbanded in January 2022.[1] Its seat was in Neuhardenberg.
The Amt Neuhardenberg consisted of the following municipalities:
Demography
[edit]-
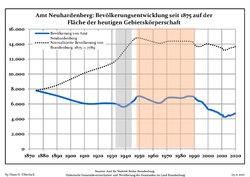
Development of Population since 1875 within the final boundaries (Blue Line: Population; Dotted Line: Comparison to Population Development of Brandenburg state; Grey Background: Time of Nazi rule; Red Background: Time of Communist rule)
-
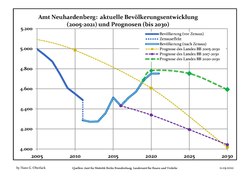
Final Population Development and Projections (Population Development before Census 2011 (blue line); Recent Population Development according to the Census in Germany in 2011 (blue bordered line); Official projections for 2005-2030 (yellow line); for 2017-2030 (scarlet line); for 2020-2030 (green line)
|
|
|
References
[edit]- ^ Gebietsänderungen vom 01. Januar bis 31. Dezember 2022, Statistisches Bundesamt
- ^ Detailed data sources are to be found in the Wikimedia Commons.Population Projection Brandenburg at Wikimedia Commons
52°35′32″N 14°16′00″E / 52.592306°N 14.266667°E


