1871 German federal election: Difference between revisions
Appearance
Content deleted Content added
m rmv duplicate map_caption parm |
No edit summary |
||
| Line 10: | Line 10: | ||
| party_colour = |
| party_colour = |
||
| party_name = |
| party_name = |
||
| previous_election = |
| previous_election = Zollparlament election, 1868 |
||
| previous_year = |
| previous_year = 1868 |
||
| previous_mps = |
| previous_mps = |
||
| election_date = {{Start date|1871|03|03|df=y}} |
| election_date = {{Start date|1871|03|03|df=y}} |
||
Revision as of 08:24, 25 November 2017
| |||||||||||||||||||||||||||||||||||||||||||||||||||||
All 382 seats in the Reichstag 192 seats needed for a majority | |||||||||||||||||||||||||||||||||||||||||||||||||||||
|---|---|---|---|---|---|---|---|---|---|---|---|---|---|---|---|---|---|---|---|---|---|---|---|---|---|---|---|---|---|---|---|---|---|---|---|---|---|---|---|---|---|---|---|---|---|---|---|---|---|---|---|---|---|
| Turnout | 52.0% | ||||||||||||||||||||||||||||||||||||||||||||||||||||
| |||||||||||||||||||||||||||||||||||||||||||||||||||||
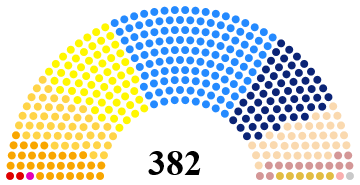
 Composition of the Reichstag after the 1871 election. | |||||||||||||||||||||||||||||||||||||||||||||||||||||
| This article is part of a series on the |
| Politics of Germany |
|---|
 |
The first Federal elections were held in Germany on 3 March 1871.[1] The National Liberal Party emerged as the largest party in the Reichstag, with 125 of the 382 seats.[2] Voter turnout was just 52.0%.[3]
Results
| Party | Votes | % | Seats |
|---|---|---|---|
| National Liberal Party | 1,171,000 | 30.1 | 125 |
| Centre Party | 724,000 | 18.6 | 63 |
| German Conservative Party | 549,000 | 14.1 | 57 |
| German Reich Party | 346,000 | 8.9 | 37 |
| German Progress Party | 342,000 | 8.8 | 46 |
| Imperial Liberal Party | 281,000 | 7.2 | 30 |
| Polish Party | 176,000 | 4.6 | 13 |
| Social Democratic Party | 124,000 | 3.2 | 2 |
| German-Hanoverian Party | 52,000 | 1.4 | 6 |
| Danish Party | 25,000 | 0.7 | 1 |
| German People's Party | 19,000 | 0.5 | 1 |
| Others | 79,000 | 2.0 | 1 |
| Invalid/blank votes | 275,500 | – | – |
| Total | 4,163,500 | 100 | 382 |
| Registered voters/turnout | 7,656,200 | 52.0 | – |
| Source: Nohlen & Stöver, DGDB | |||
