Mid-Piacenzian Warm Period: Difference between revisions
m Grammar fixes Tags: Visual edit Mobile edit Mobile web edit |
Grammar fixes Tags: Visual edit Mobile edit Mobile web edit |
||
| Line 208: | Line 208: | ||
== West Antarctic ice sheet == |
== West Antarctic ice sheet == |
||
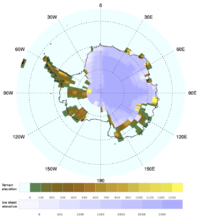
[[File:Pliocene topography ice.png|thumb|200px|Mid-Pliocene reconstructed terrain and ice sheet elevation]] |
[[File:Pliocene topography ice.png|thumb|200px|Mid-Pliocene reconstructed terrain and ice sheet elevation]] |
||
[[West Antarctic Ice Sheet]] |
The extent of the [[West Antarctic Ice Sheet]] oscillated at the 40Kyr period of Earth's obliquity. Ice sheet collapse occurred when the global average temperature was 3°C warmer than today and carbon dioxide concentration was at 400 ppmv. This resulted in open waters in the [[Ross Sea]].<ref> |
||
{{cite journal |
{{cite journal |
||
|last1=Naish |first1=T. |
|last1=Naish |first1=T. |
||
| Line 220: | Line 220: | ||
|s2cid=15213187 |
|s2cid=15213187 |
||
|display-authors=etal|url=http://digitalcommons.unl.edu/geosciencefacpub/185 |
|display-authors=etal|url=http://digitalcommons.unl.edu/geosciencefacpub/185 |
||
}}</ref> Global sea-level fluctuation associated with ice-sheet collapse |
}}</ref> Global sea-level fluctuation associated with ice-sheet collapse was probably up to 7 meters for the west Antarctic and 3 meters for the east Antarctic. |
||
Model simulations are consistent with reconstructed ice-sheet oscillations and suggest a progression from smaller to larger west Antarctic ice sheet in the last 5 |
Model simulations are consistent with reconstructed ice-sheet oscillations and suggest a progression from a smaller to a larger west Antarctic ice sheet in the last 5 million years. Intervals of ice sheet collapse were much more common in the early-mid Pliocene (5 Ma – 3 Ma), after three-million-year intervals with modern or glacial ice volume became longer and collapse occurs only at times when warmer global temperature coincide with strong austral summer insolation anomalies.<ref> |
||
{{cite journal |
{{cite journal |
||
|last1=Pollard |first1=D. |
|last1=Pollard |first1=D. |
||
Revision as of 20:00, 7 February 2021
During the Pliocene epoch (5.3 Ma to 2.6 Ma), climate became cooler and drier, and seasonal, similar to modern climates.
The global average temperature in the mid-Pliocene (3.3 Ma–3 Ma) was 2–3°C higher than today,[1] global sea level 25 meters higher,[2] and the northern hemisphere ice sheet was ephemeral before the onset of extensive glaciation over Greenland that occurred in the late Pliocene around 3 Ma.[3] The formation of an Arctic ice cap is signaled by an abrupt shift in oxygen isotope ratios and ice-rafted cobbles in the North Atlantic and North Pacific ocean beds.[4] Mid-latitude glaciation was probably underway before the end of the epoch. The global cooling that occurred during the Pliocene may have spurred on the disappearance of forests and the spread of grasslands and savannas.[5]
During the Pliocene the earth climate system response shifted from a period of high frequency-low amplitude oscillation dominated by the 41,000-year period of Earth's obliquity to one of low-frequency, high-amplitude oscillation dominated by the 100,000-year period of the orbital eccentricity characteristic of the Pleistocene glacial-interglacial cycles.[6]
The equatorial Pacific Ocean sea surface temperature gradient was considerably lower than it is today. Mean sea surface temperatures in the east were substantially warmer than today but similar in the west. This condition has been described as a permanent El Niño state, or “El Padre.”[7] Several mechanisms have been proposed for this pattern, including increased tropical cyclone activity.[8]
Setting
During the late Pliocene and early Pleistocene Series of the Cenozoic Era, 3.6 to 2.2 Ma (million years ago), the Arctic was much warmer than it is at the present day (with summer temperatures from 3.6-3.4 Ma some 8°C warmer than today). That is a key finding of research into a lake-sediment core obtained in Eastern Siberia, which is of exceptional importance because it has provided the longest continuous late Cenozoic land-based sedimentary record thus far.[9]
Global cooling and Northern hemisphere glaciation onset
Several mechanisms have been proposed to explain global cooling after 3 Ma and the onset of extensive northern hemisphere glaciation.
- Panama seaway closure[10]
The closure of the Panama seaway (13 Ma–2.5 Ma) increased the salinity contrast between Pacific and Atlantic Ocean and the northward oceanic heat transport. Warmer water increased snowfall and possibly Greenland ice sheet volume. However, model simulations suggest reduced ice volume due to increased ablation at the edge of the ice sheet under warmer conditions.[11]
- Collapse of permanent El Niño[12]
A permanent El Niño state existed in the early-mid Pliocene. Warmer temperature in the eastern equatorial Pacific caused an increased water vapor greenhouse effect and reduced the area covered by highly reflective stratus clouds, thus decreasing the albedo of the planet. Propagation of the El Niño effect through planetary waves may have warmed the polar region and delayed the onset of gl aviation in the northern hemisphere. Therefore, the appearance of cold surface water in the east equatorial Pacific around 3 million years ago may have contributed to global cooling and modified the global climate’s response to Milankovitch cycles.
- Uplift of the Rocky mountains and Greenland’s west coast[11]
Uplift of the Rocky Mountains and Greenland’s west coast may have cooled the climate due to jet stream deflection and increased snowfall due to higher surface elevation.
- Carbon dioxide
Carbon dioxide concentration during the mid-Pliocene has been estimated at around 400 ppmv from 13C/12C ratio in organic marine matter[13] and stomatal density of fossilized leaves,[14] decreasing carbon dioxide levels during late Pliocene may have contributed substantially to global cooling and the onset of northern hemisphere glaciation.[11]
West Antarctic ice sheet

The extent of the West Antarctic Ice Sheet oscillated at the 40Kyr period of Earth's obliquity. Ice sheet collapse occurred when the global average temperature was 3°C warmer than today and carbon dioxide concentration was at 400 ppmv. This resulted in open waters in the Ross Sea.[15] Global sea-level fluctuation associated with ice-sheet collapse was probably up to 7 meters for the west Antarctic and 3 meters for the east Antarctic.
Model simulations are consistent with reconstructed ice-sheet oscillations and suggest a progression from a smaller to a larger west Antarctic ice sheet in the last 5 million years. Intervals of ice sheet collapse were much more common in the early-mid Pliocene (5 Ma – 3 Ma), after three-million-year intervals with modern or glacial ice volume became longer and collapse occurs only at times when warmer global temperature coincide with strong austral summer insolation anomalies.[16]
Mid Pliocene and future climate

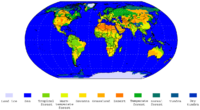
The mid Pliocene warm period is considered a potential analog of future climate. The intensity of the sunlight reaching the earth, the global geography, and carbon dioxide concentrations were similar to present. Furthermore, many mid-Pliocene species are extant helping paleotemperature proxies calibration. Model simulations of mid-Pliocene climate produce warmer conditions at middle and high latitudes, as much as 10–20 °C warmer than today above 70°N. They also indicate little temperature variation in the tropics. Model-based biomes are generally consistent with Pliocene paleobotanical data indicating a northward shift of the Tundra and Taiga and an expansion of Savanna and warm-temperate forest in Africa and Australia.[17]
See also
References
- ^ Robinson, M.; Dowsett, H. J.; Chandler, M. A. (2008). "Pliocene role in assessing future climate impacts" (PDF). Eos. 89 (49): 501–502. Bibcode:2008EOSTr..89..501R. doi:10.1029/2008EO490001. Archived from the original (PDF) on 2011-10-22.
- ^ Dwyer, G. S.; Chandler, M. A. (2009). "Mid-Pliocene sea level and continental ice volume based on coupled benthic Mg/Ca palaeotemperatures and oxygen isotopes" (PDF). Philosophical Transactions of the Royal Society A. 367 (1886): 157–168. Bibcode:2009RSPTA.367..157D. doi:10.1098/rsta.2008.0222. hdl:10161/6586. PMID 18854304. S2CID 3199617. Archived from the original (PDF) on 2011-10-21.
- ^ Bartoli, G.; et al. (2005). "Final closure of Panama and the onset of northern hemisphere glaciation". Earth and Planetary Science Letters. 237 (1–2): 33–44. Bibcode:2005E&PSL.237...33B. doi:10.1016/j.epsl.2005.06.020.
- ^ Van Andel (1994), p. 226.
- ^ Polly, D.; et al. (10 April 2011). "The Pliocene epoch". University of California Museum of Paleontology. Retrieved 2012-08-31.
- ^ Dowsett, H. J.; Chandler, M. A.; Cronin, T. M.; Dwyer, G. S. (2005). "Middle Pliocene sea surface temperature variability" (PDF). Paleoceanography. 20 (2): PA2014. Bibcode:2005PalOc..20.2014D. CiteSeerX 10.1.1.856.1776. doi:10.1029/2005PA001133. Archived from the original (PDF) on 2011-10-22.
- ^ Fedorov, A. V.; et al. (2006). "The Pliocene paradox (mechanisms for a permanent El Niño)". Science. 312 (5779): 1485–1489. Bibcode:2006Sci...312.1485F. CiteSeerX 10.1.1.143.5772. doi:10.1126/science.1122666. PMID 16763140. S2CID 36446661.
- ^ Fedorov, Alexey V.; Brierley, Christopher M.; Emanuel, Kerry (February 2010). "Tropical cyclones and permanent El Niño in the early Pliocene epoch". Nature. 463 (7284): 1066–1070. Bibcode:2010Natur.463.1066F. doi:10.1038/nature08831. hdl:1721.1/63099. ISSN 0028-0836. PMID 20182509. S2CID 4330367.
- ^ Mason, John. "The last time carbon dioxide concentrations were around 400ppm: a snapshot from Arctic Siberia". Skeptical Science. Retrieved 30 January 2014.
- ^ Haug, G. H.; Tiedemann, R. (1998). "Effect of the formation of the Isthmus of Panama on Atlantic Ocean thermohaline circulation". Nature. 393 (6686): 673–676. Bibcode:1998Natur.393..673H. doi:10.1038/31447. S2CID 4421505.
- ^ a b c Lunt, D. J.; Foster, G. L.; Haywood, A. M.; Stone, E. J. (2008). "Late Pliocene Greenland glaciation controlled by a decline in atmospheric CO2 levels". Nature. 454 (7208): 1102–1105. Bibcode:2008Natur.454.1102L. doi:10.1038/nature07223. PMID 18756254. S2CID 4364843.
- ^ Philander, S. G.; Fedorov, A. V. (2003). "Role of tropics in changing the response to Milankovich forcing some three million years ago". Paleoceanography. 18 (2): 1045. Bibcode:2003PalOc..18b..23P. doi:10.1029/2002PA000837.
- ^ Raymo, M. E.; Grant, B.; Horowitz, M.; Rau, G. H. (1996). "Mid-Pliocene warmth: Stronger greenhouse and stronger conveyor". Marine Micropaleontology. 27 (1–4): 313–326. Bibcode:1996MarMP..27..313R. doi:10.1016/0377-8398(95)00048-8.
- ^ Kurschner, W. M.; van der Burgh, J.; Visscher, H.; Dilcher, D. L. (1996). "Oak leaves as biosensors of late Neogene and early Pleistocene paleoatmospheric CO2 concentrations". Marine Micropaleontology. 27 (1–4): 299–312. Bibcode:1996MarMP..27..299K. doi:10.1016/0377-8398(95)00067-4.
- ^ Naish, T.; et al. (2009). "Obliquity-paced Pliocene West Antarctic ice sheet oscillations". Nature. 458 (7236): 322–328. Bibcode:2009Natur.458..322N. doi:10.1038/nature07867. PMID 19295607. S2CID 15213187.
- ^ Pollard, D.; DeConto, R. M. (2009). "Modelling West Antarctic ice sheet growth and collapse through the past five million years". Nature. 458 (7236): 329–332. Bibcode:2009Natur.458..329P. doi:10.1038/nature07809. PMID 19295608. S2CID 4427715.
- ^ Salzmann, U.; Haywood, A. M.; Lunt, D. J. (2009). "The past is a guide to the future? Comparing Middle Pliocene vegetation with predicted biome distributions for the twenty-first century". Philosophical Transactions of the Royal Society A. 367 (1886): 189–204. Bibcode:2009RSPTA.367..189S. doi:10.1098/rsta.2008.0200. PMID 18854302. S2CID 20422374.


