Amt Seelow-Land: Difference between revisions
Appearance
Content deleted Content added
→Demography: Figures updated |
Tom.Reding (talk | contribs) m General cleanup & WP:GenFixes on |
||
| Line 16: | Line 16: | ||
{{historical populations |
{{historical populations |
||
|align=none | cols=3 | percentages=pagr |
|align=none | cols=3 | percentages=pagr |
||
|title = Amt Seelow-Land: Population development <br>within the current boundaries (2017)<ref>Detailed data sources are to be found in the Wikimedia Commons.[http://commons.wikimedia.org/wiki/Category:Population_projection_Brandenburg Population Projection Brandenburg at Wikimedia Commons]</ref> |
|title = Amt Seelow-Land: Population development <br/>within the current boundaries (2017)<ref>Detailed data sources are to be found in the Wikimedia Commons.[http://commons.wikimedia.org/wiki/Category:Population_projection_Brandenburg Population Projection Brandenburg at Wikimedia Commons]</ref> |
||
| 1875 | 7695 |
| 1875 | 7695 |
||
| 1890 | 6907 |
| 1890 | 6907 |
||
| Line 62: | Line 62: | ||
}} |
}} |
||
| ⚫ | |||
| ⚫ | |||
{{Ämter (Brandenburg)}} |
{{Ämter (Brandenburg)}} |
||
| ⚫ | |||
{{Authority control}} |
{{Authority control}} |
||
| ⚫ | |||
| ⚫ | |||
| ⚫ | |||
[[Category:Ämter in Brandenburg|Seelow-Land]] |
[[Category:Ämter in Brandenburg|Seelow-Land]] |
||
Revision as of 22:05, 19 April 2021
Amt Seelow-Land is an Amt ("collective municipality") in the district of Märkisch-Oderland, in Brandenburg, Germany. Its seat is in Seelow, itself not part of the Amt.
The Amt Seelow-Land consists of the following municipalities:
Demography
-
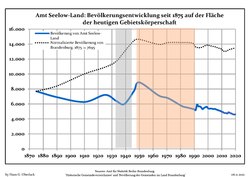
Development of Population since 1875 within the Current Boundaries (Blue Line: Population; Dotted Line: Comparison to Population Development of Brandenburg state; Grey Background: Time of Nazi rule; Red Background: Time of Communist rule)
-
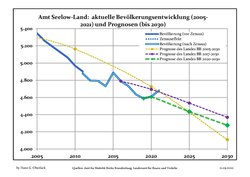
Recent Population Development and Projections (Population Development before Census 2011 (blue line); Recent Population Development according to the Census in Germany in 2011 (blue bordered line); Official projections for 2005-2030 (yellow line); for 2014-2030 (red line); for 2017-2030 (scarlet line)
|
|
|
References
- ^ Detailed data sources are to be found in the Wikimedia Commons.Population Projection Brandenburg at Wikimedia Commons
52°28′59″N 14°19′59″E / 52.483°N 14.333°E


