Puerto Limón, Putumayo: Difference between revisions
Appearance
Content deleted Content added
m →Climate: removing opinion words |
m capitalisation |
||
| Line 87: | Line 87: | ||
|footnotes = |
|footnotes = |
||
}} |
}} |
||
'''Puerto Limón''' is a settlement in the municipality of Mocoa, in the [[Putumayo Department |
'''Puerto Limón''' is a settlement in the municipality of Mocoa, in the [[Putumayo Department|Putumayo department]] of Colombia. |
||
==Climate== |
==Climate== |
||
Puerto Limón has a wet [[tropical rainforest climate]] (Af) with heavy rainfall year-round. |
Puerto Limón has a wet [[tropical rainforest climate]] (Af) with heavy rainfall year-round. |
||
Latest revision as of 11:44, 15 June 2021
This article needs additional citations for verification. (August 2020) |
Puerto Limón | |
|---|---|
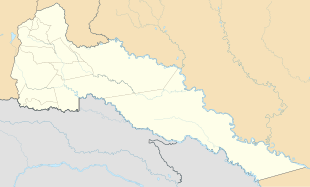
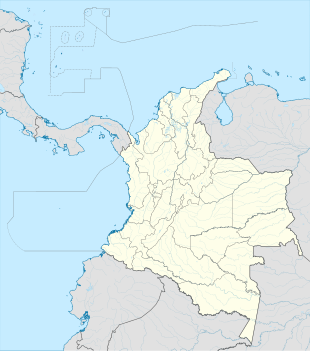
Location in Putumayo Department and Colombia | |
| Coordinates: 1°1′36.5″N 76°32′29.5″W / 1.026806°N 76.541528°W | |
| Country | |
| Department | Putumayo Department |
| Municipality | Mocoa Municipality |
| Elevation | 1,410 ft (430 m) |
| Population (2005) | |
• Total | 1,381 [1] |
| Time zone | UTC-5 (Colombia Standard Time) |
Puerto Limón is a settlement in the municipality of Mocoa, in the Putumayo department of Colombia.
Climate
[edit]Puerto Limón has a wet tropical rainforest climate (Af) with heavy rainfall year-round.
| Climate data for Puerto Limón | |||||||||||||
|---|---|---|---|---|---|---|---|---|---|---|---|---|---|
| Month | Jan | Feb | Mar | Apr | May | Jun | Jul | Aug | Sep | Oct | Nov | Dec | Year |
| Mean daily maximum °C (°F) | 29.6 (85.3) |
29.3 (84.7) |
29.1 (84.4) |
28.7 (83.7) |
28.5 (83.3) |
28.3 (82.9) |
28.6 (83.5) |
29.2 (84.6) |
29.5 (85.1) |
29.5 (85.1) |
29.2 (84.6) |
29.3 (84.7) |
29.1 (84.3) |
| Daily mean °C (°F) | 24.4 (75.9) |
24.2 (75.6) |
24.2 (75.6) |
23.9 (75.0) |
23.7 (74.7) |
23.5 (74.3) |
23.5 (74.3) |
23.8 (74.8) |
24.2 (75.6) |
24.3 (75.7) |
24.2 (75.6) |
24.3 (75.7) |
24.0 (75.2) |
| Mean daily minimum °C (°F) | 19.2 (66.6) |
19.2 (66.6) |
19.3 (66.7) |
19.2 (66.6) |
19.0 (66.2) |
18.8 (65.8) |
18.5 (65.3) |
18.5 (65.3) |
18.9 (66.0) |
19.1 (66.4) |
19.3 (66.7) |
19.3 (66.7) |
19.0 (66.2) |
| Average rainfall mm (inches) | 371.3 (14.62) |
350.4 (13.80) |
398.9 (15.70) |
607.0 (23.90) |
592.9 (23.34) |
558.0 (21.97) |
498.0 (19.61) |
365.4 (14.39) |
381.0 (15.00) |
407.8 (16.06) |
412.3 (16.23) |
446.3 (17.57) |
5,389.3 (212.19) |
| Average rainy days | 18 | 17 | 21 | 22 | 23 | 23 | 22 | 18 | 17 | 19 | 19 | 20 | 239 |
| Source: IDEAM[2] | |||||||||||||
References
[edit]- ^ "Population of Puerto Limón". citypopulation.de. Retrieved 2020-08-20.
- ^ "Data". www.ideam.gov.co. Retrieved 2020-08-19.


