Niwari district: Difference between revisions
Niwari district Tags: Visual edit Mobile edit Mobile web edit Disambiguation links added |
Niwari district Tags: wikilinks removed Visual edit Mobile edit Mobile web edit |
||
| Line 7: | Line 7: | ||
| native_name = |
| native_name = |
||
| image_skyline = Sun behind ruins.jpg |
| image_skyline = Sun behind ruins.jpg |
||
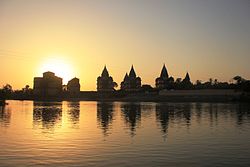
| image_caption = Ruins near [[Orchha]] in |
| image_caption = Ruins near [[Orchha]] in Niwari district, M.P |
||
| image_map = MP Niwari district map.svg |
| image_map = MP Niwari district map.svg |
||
| coordinates = |
| coordinates = |
||
Revision as of 09:03, 21 August 2022
Niwari district | |
|---|---|
 Ruins near Orchha in Niwari district, M.P | |
 | |
| Country | |
| State | Madhya Pradesh |
| Division | Sagar Division |
| Headquarters | Niwari |
| Tehsils | Niwari, Orchha, Prithvipur , Proposed Tehsil Tarichar kalan |
| Government | |
| • District Magistrate | Mr. Narendra Kumar Suryavanshi IAS |
| • Lok Sabha constituencies | Tikamgarh (Lok Sabha constituency) |
| Area | |
• Total | 1,170 km2 (450 sq mi) |
| Population | |
• Total | 404,807 |
| • Density | 350/km2 (900/sq mi) |
| Time zone | UTC+05:30 (IST) |
| Vehicle registration | MP 36 |
| Website | https://niwari.nic.in/en/ |
Niwari district is one of the 52 districts of the Madhya Pradesh state in India. Niwari town is administrative headquarter of Niwari district, MP.
This district was formed on 1 October 2018. It was formerly part of Tikamgarh district.[1][2] Niwari is the smallest district of Madhya Pradesh.
Niwari has 3 tehsils: Prithvipur, Niwari and Orchha.
Demographics
At the time of the 2011 census, Niwari district had a population of 404,807. Scheduled Castes and Scheduled Tribes make up 99,441 and 18,244 which is 24.57% and 4.51% of the population respectively.[3]
Niwari district has 396,427 Hindus which is 97.93% of the population. Muslims are 6,279 which is 1.55% of the population. Others are 2,101 which is 0.52% of the population.[4]
At the time of the 2011 census, 60.23% of the population spoke Bundeli and 39.51% Hindi as their first language.[5]
References
- ^ Ians (30 September 2018). "Niwari is 52nd district of MP". The Hindu. ISSN 0971-751X. Retrieved 16 February 2019.
- ^ "Madhya Pradesh Gets New District Carved Out". NDTV. Press Trust of India. 1 October 2018.
- ^ "District Census - Tikamgarh" (PDF). Office of the Registrar General & Census Commissioner, India. 2011.
{{cite web}}: CS1 maint: url-status (link) - ^ a b "C-16 Population By Religion - Madhya Pradesh". census.gov.in.
- ^ 2011 Census of India, Population By Mother Tongue
External links
