User:Vigneshdm1990/sandbox: Difference between revisions
Appearance
Content deleted Content added
| Line 299: | Line 299: | ||
|- |
|- |
||
} |
|} |
||
==Add2== |
==Add2== |
||
Revision as of 06:00, 3 May 2023
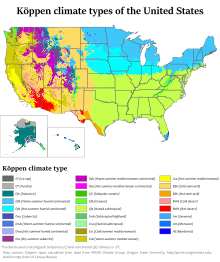
Climate maps


Natural resources maps


Energy maps


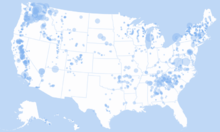

Transportation maps


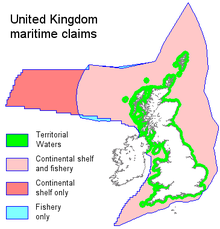
UK
- Item
Administrative Maps



Physical Maps


Climate Maps

Environmental Maps

Natural Resources Maps


Agriculture Maps

Energy Maps
Transportation Maps


Cultural Maps
Crystal structure
| Element | Type | Symbol | Atomic number | Atomic weight (amu) | Density (g/cm^3) | Crystal structure at 20° C | Atomic radius (nm) | Ionic radius (nm) | Melting point (°C) |
|---|---|---|---|---|---|---|---|---|---|
| Hydrogen | Non metal | H | 1 | 1.008 | 0.154 | -259 | |||
| Helium | Noble gas | He | 2 | 4.003 | -272 (at 26 atm) | ||||
| Lithium | Alkali metal | Li | 3 | 6.94 | 0.534 | BCC | 0.152 | 0.068 | 181 |
| Beryllium | Alkaline earth metal | Be | 4 | 9.012 | 1.85 | HCP | 0.114 | 0.035 | 1278 |
| Boron | Metalloid | B | 5 | 10.81 | Rhomb. | 0.023 | 2300 | ||
| Carbon | Non metal | C | 6 | 12.011 | 2.25 | Hex. | 0.071 | -0.016 | (sublimes at 3367) |
| Nitrogen | Non metal | N | 7 | 14.007 | 0.01--0.02 | -209.9 | |||
| Oxygen | Non metal | O | 8 | 16 | 0.14 | -218.4 | |||
| Fluorine | Non metal | F | 9 | 19 | 0.133 | -220 | |||
| Neon | Noble gas | Ne | 10 | 20.18 | -248.7 | ||||
| Sodium | Alkali metal | Na | 11 | 22.99 | 0.971 | BCC | 0.186 | 0.102 | 98 |
| Magnesium | Alkaline earth metal | Mg | 12 | 24.31 | 1.74 | HCP | 0.16 | 0.072 | 649 |
| Aluminum | Post transition metal | Al | 13 | 26.98 | 2.71 | FCC | 0.143 | 0.053 | 660.4 |
| Silicon | Metalloid | Si | 14 | 28.09 | 2.33 | Dia.cubic | 0.118 | 0.04 | 1410 |
| Phosphorus | Non metal | p | 15 | 30.97 | 1.82 | Ortho. | 0.109 | 0.035 | 44.1 |
| Sulfur | Non metal | S | 16 | 32.06 | 2.07 | Ortho. | 0.106 | 0.184 | 113 |
| Chlorine | Non metal | Cl | 17 | 35.45 | 0.181 | -101 | |||
| Argon | Noble gas | Ar | 18 | 39.95 | -189.2 | ||||
| Potassium | Alkali metal | K | 19 | 39.1 | 0.862 | BCC | 0.231 | 0.138 | 63 |
| Calcium | Alkaline earth metal | Ca | 20 | 40.08 | 1.55 | FCC | 0.197 | 0.1 | 839 |
| Titanium | Transition metal | Ti | 22 | 47.87 | 4.51 | HCP | 0.145 | 0.068 | 1668 |
| Vanadium | Transition metal | V | 23 | 50.94 | 6.1 | BCC | 0.132 | 0.059 | 1890 |
| Chromium | Transition metal | Cr | 24 | 52 | 7.19 | BCC | 0.125 | 0.063 | 1875 |
| Manganese | Transition metal | Mn | 25 | 54.94 | 7.44 | Cubic | 0.112 | 0.067 | 1244 |
| Iron | Transition metal | Fe | 26 | 55.85 | 7.87 | BCC | 0.124 | 0.077 | 1538 |
| Cobalt | Transition metal | Co | 27 | 58.93 | 8.9 | HCP | 0.125 | 0.072 | 1495 |
| Nickel | Transition metal | Ni | 28 | 58.69 | 8.9 | FCC | 0.125 | 0.069 | 1455 |
| Copper | Transition metal | Cu | 29 | 63.55 | 8.94 | FCC | 0.128 | 0.096 | 1085 |
| Zinc | Transition metal | Zn | 30 | 65.41 | 7.13 | HCP | 0.133 | 0.074 | 420 |
| Gallium | Post transition metal | Ga | 31 | 69.72 | 5.9 | Ortho. | 0.122 | 0.062 | 29.8 |
| Germanium | Metalloid | Ge | 32 | 72.64 | 5.32 | Dia. cubic | 0.122 | 0.053 | 937 |
| Bromine | Non metal | Br | 35 | 79.9 | 0.196 | -7.2 | |||
| Zirconium | Transition metal | Zr | 40 | 91.22 | 6.51 | HCP | 0.159 | 0.079 | 1852 |
| Niobium | Transition metal | Nb | 41 | 92.91 | 8.57 | BCC | 0.143 | 0.069 | 2468 |
| Molybdenum | Transition metal | Mo | 42 | 95.94 | 10.22 | BCC | 0.136 | 0.07 | 2617 |
| Silver | Transition metal | Ag | 47 | 107.87 | 10.49 | FCC | 0.144 | 0.126 | 962 |
| Cadmium | Transition metal | Cd | 48 | 112.41 | 8.65 | HCP | 0.149 | 0.095 | 321 |
| Tin | Post transition metal | Sn | 50 | 118.71 | 7.27 | Tetra. | 0.151 | 0.071 | 232 |
| Iodine | Non metal | I | 53 | 126.91 | 4.93 | Ortho. | 0.136 | 0.22 | 114 |
| Cesium | Alkali metal | Cs | 55 | 132.91 | 1.87 | BCC | 0.265 | 0.17 | 28.4 |
| Barium | Alkaline earth metal | Ba | 56 | 137.33 | 3.5 | BCC | 0.217 | 0.136 | 725 |
| Tungsten | Transition metal | W | 74 | 183.84 | 19.3 | BCC | 0.137 | 0.07 | 3410 |
| Platinum | Transition metal | Pt | 78 | 195.08 | 21.45 | FCC | 0.139 | 0.08 | 1772 |
| Gold | Transition metal | Au | 79 | 196.97 | 19.32 | FCC | 0.144 | 0.137 | 1064 |
| Mercury | Transition metal | Hg | 80 | 200.59 | 0.11 | -38.8 | |||
| Lead | Post transition metal | Pb | 82 | 207.2 | 11.35 | FCC | 0.175 | 0.12 | 327 |
Economics
- scarcity, supply and demand
- mind, Environment
- game, decision, action
- regulation, law, government, tragedy of commons
- Human centered, mental and physical Well being
- cycle of nutrients and matter. Energy.
- Production, distribution, consumption, saving/storage, investment of goods and services
- Investment, decision, risk
- cycle of money goods and growth
- finance: money, value of goods (supply and demand), exchange, value, storage, trust, promise, motivation, purchasing power,
- GDP, unemployment, Inflation, debt, interest rate
- Market: supply and demand, priced Determination, understanding trend, advertisement.
- human behavior, psychology, decision, incentives
- Banks: risk sharing, security, aids in transport of money, ideas meet idle, makes promise, gives trust,bank is money market
Codes
# Python code using matplotlib library to generate 72 images to create a gif file that shows
import matplotlib.pyplot as plt
import numpy as np
Printing first 10 Fibonacci numbers, functional expression style
Fibonacci/@Range[10]
ef[Pmat_, {d1_, d2_}, n_] := (\[Theta]i = ArcSin[Subscript[R, en] Sin[\[Theta]]/n];)
Or, alternatively, in a more functional programming approach:
If[# <= 2, 1, #0[# - 1] + #0[# - 2]] & /@ Range[10]
Notice the use of #0 to indicate the function itself.
Add1
| Column 1 | Column 2 | Column 3 |
|---|---|---|
| A | B | |
| C | D | |
| E | F | |
| G | ||
| H | ||
| Macro Regions | Meso Regions | First Order Regions | Second Order Regions |
|---|---|---|---|
| A. Great Plains | I. Rajasthan Plain | 1. Marusthali | a. Jaisalmer Marusthali |
| b. Barmer Marusthali | |||
| c. Bikaner-Churu Marusthali | |||
| 2. Rajasthan Bagar | d. Ghaggar Plain | ||
| e. Shekhawati Region | |||
| f. Nagaur Region | |||
| g. Luni Basin | |||
| II. Punjab Plain | 3.Punjab Plain North | a. Hoshiarpur—Chandigarh Plain (Sub-Mountain belt) | |
| b. Upper Bari Doab | |||
| c. Jullundur Plain | |||
| d. Punjab Malwa | |||
| 4.Punjab Plain South | e. Ambala Plain (Sub-Mountain belt) | ||
| f. Eastern Haryana (Kurukshetra Plain) | |||
| g. Western Haryana | |||
| h. Southern Haryana |
Add2
Add3
Template
This template's initial visibility currently defaults to autocollapse, meaning that if there is another collapsible item on the page (a navbox, sidebar, or table with the collapsible attribute), it is hidden apart from its title bar; if not, it is fully visible.
To change this template's initial visibility, the |state= parameter may be used:
{{Vigneshdm1990|state=collapsed}}will show the template collapsed, i.e. hidden apart from its title bar.{{Vigneshdm1990|state=expanded}}will show the template expanded, i.e. fully visible.


