Illinois's 7th congressional district: Difference between revisions
not sure what the arrow is doing here |
|||
| Line 88: | Line 88: | ||
|- |
|- |
||
| 2016 |
| rowspan=2|2016 |
||
| [[2016 United States presidential election|President]] |
| [[2016 United States presidential election|President]] |
||
| align="right" {{party shading/Democratic}} | [[Hillary Clinton]] 85.8% – [[Donald Trump]] 9.8% |
| align="right" {{party shading/Democratic}} | [[Hillary Clinton]] 85.8% – [[Donald Trump]] 9.8% |
||
|- |
|- |
||
| 2016 |
|||
| [[2016 United States Senate election in Illinois|Senate]] |
| [[2016 United States Senate election in Illinois|Senate]] |
||
| align="right" {{party shading/Democratic}} | [[Tammy Duckworth]] 81.4% – [[Mark Kirk]] 14.7% |
| align="right" {{party shading/Democratic}} | [[Tammy Duckworth]] 81.4% – [[Mark Kirk]] 14.7% |
||
|- |
|- |
||
| 2018 |
| rowspan=3|2018 |
||
| [[2018 Illinois gubernatorial election|Governor]] |
| [[2018 Illinois gubernatorial election|Governor]] |
||
| align="right" {{party shading/Democratic}} | [[J.B. Pritzker]] 82.7% – [[Bruce Rauner]] 14.2% |
| align="right" {{party shading/Democratic}} | [[J.B. Pritzker]] 82.7% – [[Bruce Rauner]] 14.2% |
||
|- |
|- |
||
| 2018 |
|||
| [[2018 Illinois attorney general election|Attorney General]] |
| [[2018 Illinois attorney general election|Attorney General]] |
||
| align="right" {{party shading/Democratic}} | [[Kwame Raoul]] 82.8% – [[Erika Harold]] 15.3% |
| align="right" {{party shading/Democratic}} | [[Kwame Raoul]] 82.8% – [[Erika Harold]] 15.3% |
||
|- |
|- |
||
| 2018 |
|||
| [[2018 Illinois Secretary of State election|Secretary of State]] |
| [[2018 Illinois Secretary of State election|Secretary of State]] |
||
| align="right" {{party shading/Democratic}} | [[Jesse White (politician)|Jesse White]] 89.1% – Jason Helland 8.6% |
| align="right" {{party shading/Democratic}} | [[Jesse White (politician)|Jesse White]] 89.1% – Jason Helland 8.6% |
||
|- |
|- |
||
| 2020 |
| rowspan=2|2020 |
||
| [[2020 United States presidential election|President]] |
| [[2020 United States presidential election|President]] |
||
| align="right" {{party shading/Democratic}} | [[Joe Biden]] 85.6% – [[Donald Trump]] 12.8% |
| align="right" {{party shading/Democratic}} | [[Joe Biden]] 85.6% – [[Donald Trump]] 12.8% |
||
|- |
|- |
||
| 2020 |
|||
| [[2020 United States Senate election in Illinois|Senate]] |
| [[2020 United States Senate election in Illinois|Senate]] |
||
| align="right" {{party shading/Democratic}} | [[Dick Durbin]] 74.7% – [[Mark Curran]] 12.2% |
| align="right" {{party shading/Democratic}} | [[Dick Durbin]] 74.7% – [[Mark Curran]] 12.2% |
||
|- |
|- |
||
| 2022 |
| rowspan=4|2022 |
||
| [[2022 United States Senate election in Illinois|Senate]] |
| [[2022 United States Senate election in Illinois|Senate]] |
||
| align="right" {{party shading/Democratic}} | [[Tammy Duckworth]] 86.0% – [[Kathy Salvi]] 12.6% |
| align="right" {{party shading/Democratic}} | [[Tammy Duckworth]] 86.0% – [[Kathy Salvi]] 12.6% |
||
|- |
|- |
||
| 2022 |
|||
| [[2022 Illinois gubernatorial election|Governor]] |
| [[2022 Illinois gubernatorial election|Governor]] |
||
| align="right" {{party shading/Democratic}} | [[J.B. Pritzker]] 85.2% – [[Darren Bailey]] 12.7% |
| align="right" {{party shading/Democratic}} | [[J.B. Pritzker]] 85.2% – [[Darren Bailey]] 12.7% |
||
|- |
|- |
||
| 2022 |
|||
| [[2022 Illinois Attorney General election|Attorney General]] |
| [[2022 Illinois Attorney General election|Attorney General]] |
||
| align="right" {{party shading/Democratic}} | [[Kwame Raoul]] 84.4% – Tom DeVore 13.7% |
| align="right" {{party shading/Democratic}} | [[Kwame Raoul]] 84.4% – Tom DeVore 13.7% |
||
|- |
|- |
||
| 2022 |
|||
| [[2022 Illinois Secretary of State election|Secretary of State]] |
| [[2022 Illinois Secretary of State election|Secretary of State]] |
||
| align="right" {{party shading/Democratic}} | [[Alexi Giannoulias]] 84.5% – [[Dan Brady (Illinois politician)|Dan Brady]] 13.5% |
| align="right" {{party shading/Democratic}} | [[Alexi Giannoulias]] 84.5% – [[Dan Brady (Illinois politician)|Dan Brady]] 13.5% |
||
Revision as of 00:49, 31 July 2023
| Illinois's 7th congressional district | |
|---|---|
Interactive map of district boundaries since January 3, 2023 | |
| Representative | |
| Area | 63 sq mi (160 km2) |
| Distribution |
|
| Population (2021) | 712,378 |
| Median household income | $70,210[1] |
| Ethnicity |
|
| Cook PVI | D+36[2] |
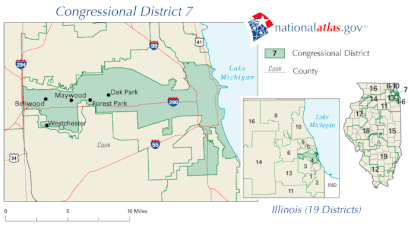
The 7th congressional district of Illinois covers parts of Cook County, as of the 2023 redistricting that followed the 2020 census. All or parts of Broadview, Bellwood, Chicago, Forest Park, Hillside, Oak Park, La Grange Park, Maywood, and Westchester are included. Democrat Danny K. Davis has represented the district since January 1997. With a Cook Partisan Voting Index rating of D+37, it is the most Democratic district in Illinois.[2]
Due to reapportionment every ten years, the 7th district like other districts has relocated in Illinois throughout its history. In the mid-1800s, Abraham Lincoln represented the 7th district before being elected president, although his home now lies within Illinois's 13th congressional district and most of his district's former territory is now located in the 18th district.[citation needed]
In 1846, the 7th district was the only one in Illinois (among seven at the time) with a comfortably safe majority for the Whig Party.[3]
Presidential election results
- This table indicates how the district has voted in U.S. presidential elections; election results reflect voting in the district as it was configured at the time of the election, not as it is configured today.
| Year | Office | Results |
|---|---|---|
| 2000 | President | Al Gore 81% - George W. Bush 16% |
| 2004 | President | John Kerry 83% - George W. Bush 17% |
| 2008 | President | Barack Obama 89% - John McCain 9% |
| 2012 | President | Barack Obama 87% - Mitt Romney 11% |
| 2016 | President | Hillary Clinton 87% - Donald Trump 9% |
| 2020 | President | Joe Biden 86% - Donald Trump 12% |
Recent election results from statewide races
- This table indicates how the district has voted in recent statewide elections; election results reflect voting in the district as it is currently configured, not necessarily as it was at the time of these elections.
| Year | Office | Results |
|---|---|---|
| 2016 | President | Hillary Clinton 85.8% – Donald Trump 9.8% |
| Senate | Tammy Duckworth 81.4% – Mark Kirk 14.7% | |
| 2018 | Governor | J.B. Pritzker 82.7% – Bruce Rauner 14.2% |
| Attorney General | Kwame Raoul 82.8% – Erika Harold 15.3% | |
| Secretary of State | Jesse White 89.1% – Jason Helland 8.6% | |
| 2020 | President | Joe Biden 85.6% – Donald Trump 12.8% |
| Senate | Dick Durbin 74.7% – Mark Curran 12.2% | |
| 2022 | Senate | Tammy Duckworth 86.0% – Kathy Salvi 12.6% |
| Governor | J.B. Pritzker 85.2% – Darren Bailey 12.7% | |
| Attorney General | Kwame Raoul 84.4% – Tom DeVore 13.7% | |
| Secretary of State | Alexi Giannoulias 84.5% – Dan Brady 13.5% |
Composition
| # | County | Seat | Population |
|---|---|---|---|
| 31 | Cook | Chicago | 5,173,146 |
As of the 2020 redistricting, this district will still be primarily based in Chicago's Central-South-West Side, as well as central Cook County.
The 7th district takes in the Chicago neighborhoods of the Loop, Armour Square, Fuller Park, Near West Side, East Garfield Park, West Garfield Park, North Lawndale, and West Englewood; most of Near South and Austin; half of Humboldt Park and Englewood; the coastal portion of Near North; part of West Town, Douglas, Grand Boulevard, and Chicago Lawn.
Outside the Chicago city limits, the 7th district takes in the Cook County communities of Oak Park, Westchester, Broadview, Bellwood, Maywood, and Forest Park; most of Hillside; and part of La Grange Park.
Election results
2012
| Party | Candidate | Votes | % | |
|---|---|---|---|---|
| Democratic | Danny K. Davis (incumbent) | 242,439 | 84.6 | |
| Republican | Rita Zak | 31,466 | 11.0 | |
| Independent | John Monaghan | 12,523 | 4.4 | |
| Independent | Phil Collins (write-in) | 5 | 0.0 | |
| Independent | Dennis Richter (write-in) | 2 | 0.0 | |
| Total votes | 286,435 | 100.0 | ||
| Democratic hold | ||||
2014
| Party | Candidate | Votes | % | |
|---|---|---|---|---|
| Democratic | Danny K. Davis (incumbent) | 155,110 | 85.1 | |
| Republican | Robert Bumpers | 27,168 | 14.9 | |
| Total votes | 182,278 | 100.0 | ||
| Democratic hold | ||||
2016
| Party | Candidate | Votes | % | |
|---|---|---|---|---|
| Democratic | Danny K. Davis (incumbent) | 250,584 | 84.2 | |
| Republican | Jeffrey Leef | 46,882 | 15.8 | |
| Total votes | 297,466 | 100.0 | ||
| Democratic hold | ||||
2018
| Party | Candidate | Votes | % | |
|---|---|---|---|---|
| Democratic | Danny K. Davis (incumbent) | 215,746 | 87.6 | |
| Republican | Craig Cameron | 30,497 | 12.4 | |
| Total votes | 246,243 | 100.0 | ||
| Democratic hold | ||||
2020
| Party | Candidate | Votes | % | ±% | |
|---|---|---|---|---|---|
| Democratic | Danny K. Davis (incumbent) | 249,383 | 80.41 | −7.21% | |
| Republican | Craig Cameron | 41,390 | 13.35 | +0.97% | |
| Independent | Tracy Jennings | 19,355 | 6.24 | N/A | |
| Total votes | 310,128 | 100.0 | |||
| Democratic hold | |||||
2022
| Party | Candidate | Votes | % | |
|---|---|---|---|---|
| Democratic | Danny K. Davis (incumbent) | 167,650 | 99.94 | |
| Write-in | 96 | 0.06 | ||
| Total votes | 167,746 | 100.0 | ||
| Democratic hold | ||||
List of members representing the district
Historical district boundaries
-
2003–2013
-
2013–2023
See also
References
- ^ Center for New Media & Promotion (CNMP), US Census Bureau. "My Congressional District". www.census.gov.
- ^ a b "2022 Cook PVI: District Map and List". Cook Political Report. Retrieved January 10, 2023.
- ^ White, Jesse, 24. Seventh Congressional District Election Returns (1846), Office of Illinois Secretary of State, retrieved January 16, 2023
- ^ "2012 General Election Official Vote Totals" (PDF). Illinois State Board of Elections. Archived from the original (PDF) on November 19, 2013. Retrieved March 26, 2012.
- ^ a b "Illinois General Election 2014". Illinois State Board of Elections. November 4, 2014. Archived from the original on March 6, 2018. Retrieved December 18, 2014.
- ^ "2018 General Election Official Vote Totals Book".
- ^ "Illinois 2020 Election Results". Chicago Sun-Times. November 20, 2020. Retrieved November 20, 2020.
- Martis, Kenneth C. (1989). The Historical Atlas of Political Parties in the United States Congress. New York: Macmillan Publishing Company.
- Martis, Kenneth C. (1982). The Historical Atlas of United States Congressional Districts. New York: Macmillan Publishing Company.
- Congressional Biographical Directory of the United States 1774–present


