Guadalupe, Peru: Difference between revisions
Appearance
Content deleted Content added
Climate |
No edit summary |
||
| Line 1: | Line 1: | ||
{{Infobox settlement |
{{Citation needed|date=October 2024}}{{Infobox settlement |
||
|official_name = Guadalupe |
|official_name = Guadalupe |
||
|other_name = |
|other_name = |
||
| Line 160: | Line 160: | ||
==References== |
==References== |
||
<references /> |
<references /> |
||
[[Category:Populated places in La Libertad Region]] |
[[Category:Populated places in La Libertad Region]] |
||
[[Category:Cities in La Libertad Region]] |
[[Category:Cities in La Libertad Region]] |
||
Revision as of 09:52, 23 October 2024
Guadalupe | |
|---|---|
Town | |
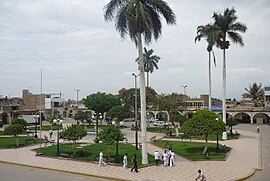
 Main Square of Guadalupe | |
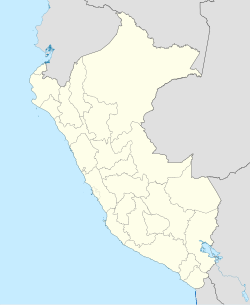
| Coordinates: 7°14′48.72″S 79°28′23.17″W / 7.2468667°S 79.4731028°W | |
| Country | |
| Region | La Libertad |
| Province | Pacasmayo |
| District | Guadalupe |
| Government | |
| • Mayor | Benjamín Javier Banda Abanto |
| Elevation | 92 m (302 ft) |
| Population | |
• Estimate (2015)[1] | 43,356 |
| Time zone | UTC-5 (PET) |
Guadalupe (Colonial Mochica: Namæl) is a city in Northern Peru, capital of the district Guadalupe in the region La Libertad. This town is located some 127 km north Trujillo city and is primarily an agricultural center in the Jequetepeque Valley.
The Universidad Nacional de Trujillo has a small campus on the north east edge of Guadalupe.
Climate
| Climate data for Guadalupe (Talla), elevation 117 m (384 ft), (1991–2020) | |||||||||||||
|---|---|---|---|---|---|---|---|---|---|---|---|---|---|
| Month | Jan | Feb | Mar | Apr | May | Jun | Jul | Aug | Sep | Oct | Nov | Dec | Year |
| Mean daily maximum °C (°F) | 29.5 (85.1) |
30.2 (86.4) |
30.3 (86.5) |
29.4 (84.9) |
27.8 (82.0) |
25.8 (78.4) |
24.9 (76.8) |
24.8 (76.6) |
25.6 (78.1) |
26.3 (79.3) |
26.9 (80.4) |
28.2 (82.8) |
27.5 (81.4) |
| Mean daily minimum °C (°F) | 20.2 (68.4) |
21.2 (70.2) |
20.8 (69.4) |
19.1 (66.4) |
17.3 (63.1) |
15.6 (60.1) |
14.4 (57.9) |
14.2 (57.6) |
14.7 (58.5) |
15.4 (59.7) |
16.1 (61.0) |
18.3 (64.9) |
17.3 (63.1) |
| Average precipitation mm (inches) | 6.5 (0.26) |
14.2 (0.56) |
17.6 (0.69) |
3.5 (0.14) |
0.9 (0.04) |
0.2 (0.01) |
0.0 (0.0) |
0.2 (0.01) |
0.4 (0.02) |
1.4 (0.06) |
1.3 (0.05) |
4.9 (0.19) |
51.1 (2.03) |
| Source: National Meteorology and Hydrology Service of Peru[2] | |||||||||||||
See also
References
- ^ Perú: Población estimada al 30 de junio y tasa de crecimiento de las ciudades capitales, por departamento, 2011 y 2015. Perú: Estimaciones y proyecciones de población total por sexo de las principales ciudades, 2012-2015 (Report). Instituto Nacional de Estadística e Informática. March 2012. Retrieved 2015-06-03.
- ^ "Normales Climáticas Estándares y Medias 1991-2020". National Meteorology and Hydrology Service of Peru. Archived from the original on 21 August 2023. Retrieved 17 June 2024.


