Acoustical measurements and instrumentation: Difference between revisions
reflist added, images turned into gallery |
m fix to gallery |
||
| Line 15: | Line 15: | ||
Audio and acoustic analysis includes: fractional-octave analysis, sound-level measurements, power spectra, frequency response measurements, and transient analysis. Results are viewed on waterfall displays, colormap displays, and octave graphs. |
Audio and acoustic analysis includes: fractional-octave analysis, sound-level measurements, power spectra, frequency response measurements, and transient analysis. Results are viewed on waterfall displays, colormap displays, and octave graphs. |
||
<gallery> |
<gallery> |
||
[[Image:Octave_Analysis_Graph.JPG |
[[Image:Octave_Analysis_Graph.JPG|Third Octave Analysis]] |
||
Image:FFT_Graph.JPG |
Image:FFT_Graph.JPG|FFT |
||
Image:FRF_Graph.JPG |
Image:FRF_Graph.JPG|Frequency Response Function |
||
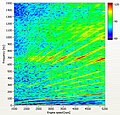
Image:Spectral_Map_Graph.JPG|256px|thumb|left|Color Map |
Image:Spectral_Map_Graph.JPG|256px|thumb|left|Color Map |
||
</gallery> |
</gallery> |
||
Revision as of 19:26, 15 July 2009
Analysis of sound and acoustics plays a role in such engineering tasks as product design, production test, machine performance, and process control. For instance, product design can require modification of sound level or noise for compliance with standards from ANSI, IEC, and ISO. The work might also involve design fine-tuning to meet market expectations. Here, examples include tweaking an automobile door latching mechanism to impress a consumer with a satisfying click or modifying an exhaust manifold to change the tone of an engine's rumble. Aircraft designers are also using acoustic instrumentation to reduce the noise generated on takeoff and landing.
Acoustical measurements and instrumentation range from a handheld sound level meter to a 1000-microphone phased array. Most of the acoustical measurement and instrumentation systems can be broken down into three components:
1) Sensors
2) Data Acquisition
3) Analysis
Sensors
The most common sensor used for acoustic measurement is the microphone. Measurement-grade microphones are different than typical recording-studio microphones because they can provide a detailed calibration for their response and sensitivity. Other sensors include hydrophones for measuring sound in water or accelerometers for measuring vibrations causing sound. The three main groups of microphones are pressure, free-field, and random-incidence, each with their own correction factors for different applications.[1] Well-known microphone suppliers include PCB Piezotronics and Brüel & Kjær.
Data Acquisition
Data acquisition hardware for acoustic measurements typically utilizes 24-bit analog-to-digital converters (ADCs), anti-aliasing filters, and other signal conditioning. This signal conditioning may include amplification, filtering, sensor excitation, and input configuration. Another consideration is the frequency range of the instrumentation. It should be large enough to cover the frequency range of signal interest, taking into account the range of the sensor. To prevent aliasing, many devices come with antialiasing filters, which cut the maximum frequency range of the device to a little less than one-half the maximum sampling rate, as prescribed by the Nyquist sampling theorem. Dynamic range is a common way to compare performance from one instrument to another. Dynamic range is a measure of how small you can measure a signal relative to the maximum input signal the device can measure. Expressed in decibels, the dynamic range is 20 log (Vmax/Vmin). For example, a device with an input range of ±10 V and a dynamic range of 110 dB will be able to measure a signal as small as 10 µV. Thus, the input range and the specified dynamic range are important for determining the needs of your instrumentation system. Some well known vendors include Brüel & Kjær, National Instruments, and LMS International, Prosig, and OROS.
Analysis
Audio and acoustic analysis includes: fractional-octave analysis, sound-level measurements, power spectra, frequency response measurements, and transient analysis. Results are viewed on waterfall displays, colormap displays, and octave graphs.
-
FFT
-
Frequency Response Function
-
Color Map
References
- ^ G.R.A.S. Sound & Vibration has a selection guide detailing the difference between microphones.


