Expected value of including uncertainty: Difference between revisions
The example |
|||
| Line 93: | Line 93: | ||
*[[Expected value of perfect information]] (EVPI) |
*[[Expected value of perfect information]] (EVPI) |
||
*[[Expected value of sample information]] |
*[[Expected value of sample information]] |
||
*[[Analytica]] visual modeling and decision analysis software |
|||
[[Category:Decision theory]] |
[[Category:Decision theory]] |
||
Revision as of 23:27, 28 April 2010
This article provides insufficient context for those unfamiliar with the subject. (April 2010) |
In decision theory and quantitative policy analysis, the expected value of including information (EVIU) is the expected difference in the value of a decision based on a probabilistic analysis versus a decision based on an analysis that ignores uncertainty.[1][2]
Formalization
Let
When not including uncertainty, you find the optimal decision using only , the expected value of the uncertain quantity. Hence, the decision ignoring uncertainty is given by:
The optimal decision taking uncertainty into account is
The EVIU is thus
The uncertainty quantity may be comprised of many scalar variables, in which case the space is a vector space.
Example

The plane catching example described here is taken, with permission from Lumina Decision Systems, from an example model shipped with the Analytica visual modeling software.
The diagram shows an influence diagram depiction of an Analytica model for deciding how early I should leave from home in order to catch my flight from the airport. The single decision, in the green rectangle, is the number of minutes that I will decide to leave prior to my plane's departure time. Four uncertain variables appear on the diagram in cyan ovals: The time required to drive from home to the airport's parking garage (in minutes), time to get from the parking garage to the gate (in minutes), the time before departure that I need to be at the gate by, and the loss (in minutes) incurred if I miss the flight. Each of these nodes contains a probability distribution, viz:
Time_to_drive_to_airport   := LogNormal(median:60,gsdev:1.3)
Time_from_parking_to_gate  := LogNormal(median:10,gsdev:1.3)
Gate_time_before_departure := Triangular(min:20,mode:30,max:40)
Loss_if_miss_the_plane     := LogNormal(median:400,stddev:100)
Each of these distributions is taken to be statistically independent. The probability distribution for the first uncertain variable, Time_to_drive_to_airport, with median 60 and a geometric standard deviation of 1.3, is depicted in this graph:
The model calculates the cost (the red hexagonal variable) as the number of minutes (or minute equivalents) consumed to successfully board the plane. If I arrive too late, I will miss my plane and incur the large loss (negative utility) of having to wait for the next flight. If I arrive too early, I'll incur the cost of having to needlessly wait around for my flight.
Models that utilize EVIU may use a utility function, or equivalently they may utilize a loss function, in which case the utility function is just the negative of the loss function. In either case, the EVIU will be positive. The main difference is just that with a loss function, you make a decision by minimizing loss, rather than by maximizing utility. The example here uses a loss-function, Cost.
The definitions for each of the computed variables is thus:
Time_from_home_to_gate := Time_to_drive_to_airport + Time_from_parking_to_gate + Loss_if_miss_the_plane
Value_per_minute_at_home := 1
Cost := Value_per_minute_at_home * Time_I_leave_home +
           (If Time_I_leave_home < Time_from_home_to_gate Then Loss_if_miss_the_plane Else 0)
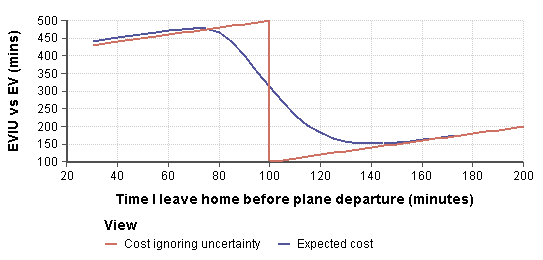
The following graph displays the expected value taking uncertainty into account (the smooth blue curve) to the expected utility ignoring uncertainty, graphed as a function of the decision variable.
Notice that when we ignore uncertainty here, we act as though we will make our flight with certainty as long as we leave at least 100 minutes before our flight, and will miss our flight with certainty if we leave any later than that. Because we act as if everything is uncertain, the optimal action is to leave exactly 100 minutes (or 100 minutes, 1 second) before our flight.
When we take uncertainty into account, the expected value smooths out (the blue curve), and the optimal action is to leave 140 minutes before our flight. The expected value curve, with a decision at 100 minutes before the flight, shows the expected cost when ignoring uncertainty to be 313.7 minutes, while the expected cost when we leave 140 minute prior is 151 minutes. The difference between these two is the EVIU:
In other words, if we explicitly take uncertainty into account when we make our decision, we will save ourselves 162.7 minutes on average.
Relation to Expected Value of Perfect Information (EVPI)
Both EVIU and EVPI compare the expected value of the Bayes' decision with another decision made without uncertainty. For EVIU this other decision is made when the uncertainty is ignored, although it is there, while for EVPI this other decision is made after the uncertainty is removed by obtaining perfect information about x.
The EVPI is the expected cost of being uncertain about x, while the EVIU is the additional expected cost of pretending you are not uncertain.
The EVIU, like the EVPI, gives expected value in terms of the units of the utility function.
References
- ^ Morgan, M. Granger and Henrion, Max (1990), "Uncertainty: A Guide to Dealing with Uncertainty in Quantitative Risk and Policy Analysis", Cambridge University Press, Chap. 12.
- ^ Henrion, M. (1982), "The value of knowing how little you know: The advantages of a probabilistic treatment of uncertainty in policy analysis", Ph.D. diss., Carnegie Mellon, Univeristy, Pittsburgh.
See also
- Expected value of perfect information (EVPI)
- Expected value of sample information
- Analytica visual modeling and decision analysis software


![{\displaystyle E[x]}](https://wikimedia.org/enwiki/api/rest_v1/media/math/render/svg/604728821497d9094bd347a8e27040b2ff58c88c)
![{\displaystyle d_{iu}={\arg \max _{d}}~U(d,E[x])}](https://wikimedia.org/enwiki/api/rest_v1/media/math/render/svg/b30ebdb3e96173692ad8c1f7ecac270ed3a7d9e5)

![{\displaystyle EVIU=\int _{X}\left[U(d^{*},x)-U(d_{iu},x)\right]f(x)dx}](https://wikimedia.org/enwiki/api/rest_v1/media/math/render/svg/e77315da027b7e2d254ef1bbebfc1f8c9e1c9f16)


