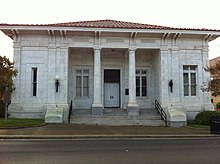
Forrest County, Mississippi
Forrest County | |
|---|---|
 | |
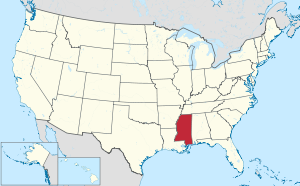
 Location within the U.S. state of Mississippi | |
 Mississippi's location within the U.S. | |
| Coordinates: 31°11′N 89°16′W / 31.19°N 89.26°W | |
| Country | |
| State | |
| Founded | 1908[1] |
| Named for | Nathan B. Forrest |
| Seat | Hattiesburg |
| Largest city | Hattiesburg |
| Area | |
• Total | 470 sq mi (1,200 km2) |
| • Land | 466 sq mi (1,210 km2) |
| • Water | 3.9 sq mi (10 km2) 0.8% |
| Population (2010) | |
• Total | 74,934 |
• Estimate (2018) | 75,036 |
| • Density | 160/sq mi (62/km2) |
| Time zone | UTC−6 (Central) |
| • Summer (DST) | UTC−5 (CDT) |
| Congressional district | 4th |
| Website | forrestcountyms |
Forrest County is located in the U.S. state of Mississippi. As of the 2010 census, the population was 74,934.[2] Its county seat and largest city is Hattiesburg.[3] The county was created from Perry County in 1908 and named in honor of Nathan Bedford Forrest, a Confederate general in the American Civil War and the first Grand Wizard of the Ku Klux Klan. Forrest County is part of the Hattiesburg, MS Metropolitan Statistical Area.
Geography
According to the U.S. Census Bureau, the county has a total area of 470 square miles (1,200 km2), of which 466 square miles (1,210 km2) is land and 3.9 square miles (10 km2) (0.8%) is water.[4]
Major highways
 Interstate 59
 U.S. Highway 11
 U.S. Highway 49
 U.S. Highway 98
 Mississippi Highway 13
 Mississippi Highway 42
Adjacent counties
- Jones County (northeast)
- Perry County (east)
- Stone County (south)
- Pearl River County (southwest)
- Lamar County (west)
- Covington County (northwest)
National protected area
- De Soto National Forest (part)
Demographics
| Census | Pop. | Note | %± |
|---|---|---|---|
| 1910 | 20,722 | — | |
| 1920 | 21,238 | 2.5% | |
| 1930 | 30,115 | 41.8% | |
| 1940 | 34,901 | 15.9% | |
| 1950 | 45,055 | 29.1% | |
| 1960 | 52,722 | 17.0% | |
| 1970 | 57,849 | 9.7% | |
| 1980 | 66,018 | 14.1% | |
| 1990 | 68,314 | 3.5% | |
| 2000 | 72,604 | 6.3% | |
| 2010 | 74,934 | 3.2% | |
| 2018 (est.) | 75,036 | [5] | 0.1% |
| U.S. Decennial Census[6] 1790-1960[7] 1900-1990[8] 1990-2000[9] 2010-2013[2] | |||
2020 census
| Race | Num. | Perc. |
|---|---|---|
| White (non-Hispanic) | 43,121 | 55.17% |
| Black or African American (non-Hispanic) | 28,151 | 36.02% |
| Native American | 177 | 0.23% |
| Asian | 789 | 1.01% |
| Pacific Islander | 29 | 0.04% |
| Other/Mixed | 2,633 | 3.37% |
| Hispanic or Latino | 3,258 | 4.17% |
As of the 2020 United States census, there were 78,158 people, 27,340 households, and 15,633 families residing in the county.
2000 census
As of the census[11] of 2000, there were 72,604 people, 27,183 households, and 17,315 families residing in the county. The population density was 156 people per square mile (60/km2). There were 29,913 housing units at an average density of 64 per square mile (25/km2). The racial makeup of the county was 64.34% White, 33.55% Black or African American, 0.19% Native American, 0.74% Asian, 0.02% Pacific Islander, 0.40% from other races, and 0.75% from two or more races. 1.26% of the population were Hispanic or Latino of any race.
There were 27,183 households, out of which 31.00% had children under the age of 18 living with them, 42.60% were married couples living together, 17.20% had a female householder with no husband present, and 36.30% were non-families. 28.50% of all households were made up of individuals, and 8.80% had someone living alone who was 65 years of age or older. The average household size was 2.47 and the average family size was 3.07.
In the county, the population was spread out, with 24.50% under the age of 18, 18.20% from 18 to 24, 27.60% from 25 to 44, 18.30% from 45 to 64, and 11.30% who were 65 years of age or older. The median age was 30 years. For every 100 females, there were 89.30 males. For every 100 females age 18 and over, there were 85.30 males.
The median income for a household in the county was $27,420, and the median income for a family was $35,791. Males had a median income of $28,742 versus $20,500 for females. The per capita income for the county was $15,160. About 17.10% of families and 22.50% of the population were below the poverty line, including 28.60% of those under age 18 and 12.80% of those age 65 or over.
Communities
Cities
- Hattiesburg (county seat; small portion in Lamar County)
- Petal
Census-designated places
- Eastabuchie (located mostly in Jones County)
- Glendale
- Rawls Springs
Other unincorporated communities
Ghost towns
Politics
Forrest County has not supported the National Democratic ticket for President since 1944, when it voted overwhelmingly for Franklin Roosevelt in his landslide record fourth term victory. That is the longest such streak of any county in the state. Only twice since then has it not voted Republican, in 1948 when it backed the States Rights ticket of Strom Thurmond and then-Mississippi Governor Fielding Wright, and in 1968 when it voted for George Wallace and Curtis LeMay.
| Year | Republican | Democratic | Third party(ies) | |||
|---|---|---|---|---|---|---|
| No. | % | No. | % | No. | % | |
| 2020 | 17,290 | 54.62% | 13,755 | 43.45% | 609 | 1.92% |
| 2016 | 15,461 | 55.09% | 11,716 | 41.75% | 887 | 3.16% |
| 2012 | 16,574 | 54.82% | 13,272 | 43.89% | 390 | 1.29% |
| 2008 | 15,296 | 56.27% | 11,622 | 42.75% | 266 | 0.98% |
| 2004 | 16,318 | 61.01% | 10,220 | 38.21% | 207 | 0.77% |
| 2000 | 13,281 | 59.69% | 8,500 | 38.20% | 470 | 2.11% |
| 1996 | 11,278 | 55.17% | 7,965 | 38.96% | 1,199 | 5.87% |
| 1992 | 12,432 | 54.64% | 8,333 | 36.62% | 1,988 | 8.74% |
| 1988 | 14,249 | 66.84% | 6,953 | 32.62% | 116 | 0.54% |
| 1984 | 15,719 | 69.63% | 6,786 | 30.06% | 71 | 0.31% |
| 1980 | 12,656 | 59.34% | 8,274 | 38.80% | 397 | 1.86% |
| 1976 | 10,770 | 56.33% | 7,914 | 41.39% | 436 | 2.28% |
| 1972 | 14,418 | 80.56% | 2,933 | 16.39% | 547 | 3.06% |
| 1968 | 3,294 | 20.30% | 2,957 | 18.22% | 9,975 | 61.48% |
| 1964 | 9,291 | 89.17% | 1,128 | 10.83% | 0 | 0.00% |
| 1960 | 3,412 | 39.53% | 2,068 | 23.96% | 3,152 | 36.52% |
| 1956 | 2,256 | 37.52% | 1,928 | 32.06% | 1,829 | 30.42% |
| 1952 | 4,480 | 60.41% | 2,936 | 39.59% | 0 | 0.00% |
| 1948 | 167 | 2.84% | 406 | 6.90% | 5,307 | 90.26% |
| 1944 | 436 | 10.67% | 3,649 | 89.33% | 0 | 0.00% |
| 1940 | 228 | 6.88% | 3,075 | 92.82% | 10 | 0.30% |
| 1936 | 234 | 6.09% | 3,596 | 93.62% | 11 | 0.29% |
| 1932 | 182 | 7.98% | 2,068 | 90.70% | 30 | 1.32% |
| 1928 | 1,447 | 44.66% | 1,793 | 55.34% | 0 | 0.00% |
| 1924 | 156 | 7.31% | 1,826 | 85.57% | 152 | 7.12% |
| 1920 | 140 | 10.36% | 1,146 | 84.76% | 66 | 4.88% |
| 1916 | 54 | 4.28% | 1,146 | 90.81% | 62 | 4.91% |
| 1912 | 16 | 1.49% | 886 | 82.57% | 171 | 15.94% |
See also
References
- ^ "History". Forrest County, Mississippi. Retrieved November 9, 2014.
- ^ a b "State & County QuickFacts". United States Census Bureau. Archived from the original on July 18, 2011. Retrieved September 3, 2013.
- ^ "Find a County". National Association of Counties. Archived from the original on May 31, 2011. Retrieved June 7, 2011.
- ^ "2010 Census Gazetteer Files". United States Census Bureau. August 22, 2012. Archived from the original on September 28, 2013. Retrieved November 3, 2014.
- ^ "Population and Housing Unit Estimates". Retrieved November 11, 2019.
- ^ "U.S. Decennial Census". United States Census Bureau. Retrieved November 3, 2014.
- ^ "Historical Census Browser". University of Virginia Library. Retrieved November 3, 2014.
- ^ "Population of Counties by Decennial Census: 1900 to 1990". United States Census Bureau. Retrieved November 3, 2014.
- ^ "Census 2000 PHC-T-4. Ranking Tables for Counties: 1990 and 2000" (PDF). United States Census Bureau. Archived (PDF) from the original on March 27, 2010. Retrieved November 3, 2014.
- ^ "Explore Census Data". data.census.gov. Retrieved December 16, 2021.
- ^ "U.S. Census website". United States Census Bureau. Retrieved January 31, 2008.
- ^ Leip, David. "Dave Leip's Atlas of U.S. Presidential Elections". uselectionatlas.org. Retrieved March 3, 2018.

