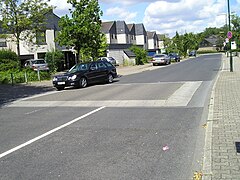
Traffic calming

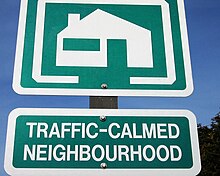
Traffic calming uses physical design and other measures to improve safety for motorists, car drivers, pedestrians and cyclists. It has become a tool to combat speeding and other unsafe behaviours of drivers.[1] It aims to encourage safer, more responsible driving and potentially reduce traffic flow. Urban planners and traffic engineers have many strategies for traffic calming, including narrowed roads and speed humps. Such measures are common in Australia and Europe (especially Northern Europe), but less so in North America. Traffic calming is a calque (literal translation) of the German word Verkehrsberuhigung – the term's first published use in English was in 1985 by Carmen Hass-Klau.[2]
History
In its early development in the UK in the 1930s, traffic calming was based on the idea that residential areas should be protected from through-traffic. Subsequently, it became valued for its ability to improve pedestrian safety and reduce noise and air pollution from traffic.[citation needed]
For much of the 20th century, streets were designed by engineers who were charged only with ensuring smooth motor vehicular traffic flow and not with fostering the other functions of streets. Traffic calming initiatives have grown to consider other design functions as well. For example, it has been shown that car traffic severely impairs the social and recreational functions of public streets. The Livable Streets study by Donald Appleyard (1981)[3] found that residents of streets with light traffic had, on average, three more friends and twice as many acquaintances as the people on streets with heavy traffic which were otherwise similar in dimensions, income, etc.[citation needed]
Measures
Traffic engineers refer to three "E's" when discussing traffic calming: engineering, (community) education, and (police) enforcement. Because neighborhood traffic management studies have shown that residents often contribute to the perceived speeding problem within their neighborhoods, instructions on traffic calming (for example in Hass-Klau et al., 1992[4]) stress that the most effective traffic calming plans entail all three components—that engineering measures alone will not produce satisfactory results.
Engineering measures
Engineering measures involve physically altering the road layout or appearance to actively or passively reduce traffic speeds by one of several means:
- increasing the cognitive load of driving (making driving more difficult)
- increasing the chance that an obstruction in the road will slow or momentarily stop motorists (such as replacing a bus pullout with a bus bulb, causing transit vehicles to stop for passenger loading and unloading in the travel lane, rather than pulling off and letting cars pass)
- increasing the chance of passenger discomfort or even physical damage to a vehicle if speed limits are not observed (such as speed humps).[citation needed]
Measures include speed humps, chicanes, curb extensions, modal filters, and living street and shared space type schemes. The town of Hilden in Germany has achieved a rate of 24% of trips being on two wheels, mainly via traffic calming and the use of 30 km/h or 20 mph zones.[5] In 1999, the Netherlands had over 6000 woonerven where cyclists and pedestrians have legal priority over cars and where a motorised "walking speed" limit applies.[6] However, some UK and Irish "traffic calming" schemes, particularly involving road narrowings, are viewed as extremely hostile and have been implicated directly in death and injury to cyclists and pedestrians.[7][8]
A number of visual changes to roads are being made to encourage more attentive driving, reduced speed, reduced crashes, and a greater tendency to yield to pedestrians. Visual traffic calming includes lane narrowings (9–10'), road diets (reduction in lanes), use of trees next to streets, on-street parking, and buildings placed in urban fashion close to streets.

Physical devices include speed humps, speed cushions and speed tables, sized for the desired speed. Such measures normally slow cars to between 10 and 25 miles per hour (16 and 40 km/h). Most devices are made of asphalt or concrete but rubber traffic calming products are emerging as an effective alternative with several advantages.
Physical traffic calming can include the following engineering measures, grouped by similarity of method:[9]
- Narrowing: Narrowing traffic lanes makes slower speeds seem more natural to drivers and are less intrusive than other treatments that limit speed or restrict route choice. Narrowing measures include:
- Lane narrowings can be created by extending sidewalks, adding bollards or planters, or adding a bike lane or on-street parking.[10]
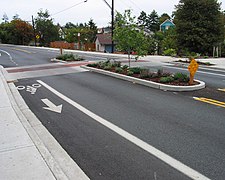
- Curb extensions (also called bulbouts) narrow the width of the roadway at pedestrian crossings
- Chokers are curb extensions that narrow roadways to a single lane at certain points[11]
- Road diets remove a lane from the street. For example, allowing parking on one or both sides of a street to reduce the number of driving lanes.
- Pedestrian refuges or small islands in the middle of the street can help reduce lane widths.
- Converting one-way streets into two-way streets forces opposing traffic into close proximity, which requires more careful driving.

- Vertical deflection: Raising a portion of a road surface can create discomfort for drivers travelling at high speeds. Both the height of the deflection and the steepness affect the severity of vehicle displacement. Vertical deflection measures include:
- Speed bumps, sometimes split or offset in the middle to avoid delaying emergency vehicles
- Speed humps, parabolic devices that are less aggressive than speed bumps.
- Speed cushions, two or three small speed humps sitting in a line across the road that slow cars down but allows wider emergency vehicles to straddle them so as not to slow emergency response time.
- Speed tables, long flat-topped speed humps that slow cars more gradually than humps.
- Raised pedestrian crossings, which act as speed tables, often situated at junctions.
- Raised intersections, like raised pedestrian crossings, act as speed tables.
- Speed dips, sunken instead of raised (often seen as double dips in cycleways in The Netherlands).[12]
- Changing the surface material or texture (for example, the selective use of brick, cobblestone, or polymer cement overlay). Changes in texture may also include changes in color to highlight to drivers that they are in a pedestrian-centric zone.
- Rumble strips, when placed perpendicular to traffic in the travel lane (rather than placed between lanes parallel to traffic) act as speed bumps as they produce unpleasant sounds and vibration when crossed at higher speeds.
- Horizontal deflection, i.e. make the vehicle swerve slightly. These include:
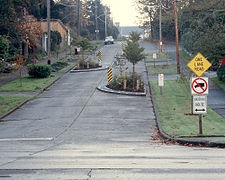
- Chicanes, which create a horizontal deflection that causes vehicles to slow as they would for a curve.
- Pedestrian refuges again can provide horizontal deflection, as can kerb extensions and chokers.
- Roundabouts and traffic circles provide another source of horizontal deflection especially when integrated within intersecting roads

- Block or restrict access. Such traffic calming means include:
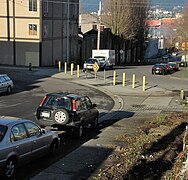
- Median diverters to prevent left turns or through movements into a residential area.
- Converting an intersection into a cul-de-sac or dead end.
- Boom barrier, restricting through traffic to authorised vehicles only.
- Closing of streets to create pedestrian zones.
- Other means
Quite often residents have used a variety of homemade devices ranging from faux enforcement camera signs and even faux speed cameras and including dummy police. Some Canadian communities erect flexible bollards in the middle of the street in school zones. The bollards have a sign affixed indicating a 40 km/h speed limit.
Implementation Strategies
There are primarily two implementation options for the creation of traffic calming measure: capital reconstruction versus operational changes.[citation needed]
- Capital reconstruction is rebuilding a street, which may involve moving infrastructure (such as sewers, water lines, electrical equipment) and adjusting the location, size and path of the roadway. Typically, capital reconstruction involves years of planning and design, and millions of dollars of investment.
- Operational changes to a road have to do with more short-term changes that typically implement minor adjustments within the existing curbline or that do not require rebuilding the road. These treatments range from a very temporary use of safety cones or other safety-approved traffic management devices, such as flexible bollards, that test a traffic-calming initiative for a few days to longer-term operational changes that may include restriping a street, which is best to plan around any routine maintenance resurfacing.
Enforcement and education measures
Enforcement and education measures for traffic calming include:
- Reducing speed limits near institutions such as schools and hospitals (see below)
- Vehicle activated signs and radar speed feedback signs, signs which react with a message if they detect a vehicle exceeding a pre-determined speed.
- Embedded pavement flashing-light systems which react to pedestrian presence at crossings to signal drivers and increase awareness.
- Watchman, traffic calming system
Speed limits
Speed reduction has traditionally been attempted by the introduction of statutory speed limits. Traffic speeds of 30 km/h (20 mph) and lower are said to be more desirable on urban roads with mixed traffic.[13] The Austrian city of Graz, which has achieved steady growth in cycling, has applied 30 km/h limits to 75% its streets since 1994.[14] Zones where speeds are set at 30 km/h (or 20 mph) are preferred by some[15] as they are found to be effective at reducing crashes and increasing community cohesion.[16] Speed limits which are set below the speed that most motorists perceive to be reasonable for the given road require additional measures to improve compliance. Attempts to improve speed limit observance are usually by either education, enforcement or road engineering. "Education" can mean publicity campaigns or targeted road user training.
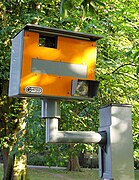
Speed limit enforcement techniques include: direct police action, automated systems such as speed cameras or vehicle activated signs or traffic lights triggered by traffic exceeding a preset speed threshold. One cycling expert argues for placing direct restrictions on motor-vehicle speed and acceleration performance.[17] An EU report on promoting walking and cycling specifies as one of its top measures comprehensive camera-based speed control using mainly movable equipment at unexpected spots.[18] The Netherlands has an estimated 1,500 speed/red-light camera installations and has set a target for 30 km/h limits on 70% of urban roads. The UK has more than 6,000 speed cameras, which took more than £100 million in fines in 2006/07.[19]
Examples around the world
Europe
Traffic calming has been successfully used for decades in cities across Europe. For example, a living street (sometimes known as home zones or by the Dutch word woonerf, as the concept originated in the Netherlands) towards the end of the 1960s, initially in Delft, is a street in which the needs of car drivers are secondary to the needs of other road users; traffic calming principles are integrated into their design. From the Netherlands, the concept spread rapidly to Germany, starting in North Rhine-Westphalia in 1976, and had become very widespread by the early 1980s. The ideas and techniques also spread to the UK towards the end of the 1980s, and practice there was advocated by academics such as Tim Pharaoh and Carmen Hass-Klau. The guidelines published by Devon County Council (of which Tim Pharaoh was the principal author) in 1991 were particularly well received.[20]

In the United Kingdom, Low Traffic Neighbourhoods incorporate traffic calming and filtered permeability. In 2020, some LTNs were introduced with emergency funding from the government,[21] in response to the COVID-19 pandemic.[22] A study found that people living in LTNs in Waltham Forest became less likely to own a car and were more likely to walk or cycle.[23]
School Streets are another UK scheme which involves part-time restrictions on motor vehicles during school pick up and drop off times.

In Ireland, traffic calming schemes have been implemented on national roads since 1993, typically on those with a hard shoulder, on the approach to towns and villages where the speed limit is reduced from 100 km/h to 50 or 60 km/h. This is done by reducing the width of the hard shoulder and the carriageway, various landscaping and installation of 'gateways' in order to reduce the driver's field of view and thus their speed.[24] A gateway marks the transition from high-speed to low-speed road and may feature a pavement, cycle lane, central island (where the road is sufficiently wide enough) or all three, and is accompanied with town/village entrance and speed limit signs as well as bollards and a lamppost in the island.
An evaluation of 91 traffic calming schemes implemented between 1997 and 2002 showed that they were successful in reducing road collisions, the number of which decreased by 13%. The number of fatal collisions was reduced by 52%.[25]
North America
By 2017, San Francisco's Vision Zero program, which heavily features traffic calming, has reduced fatalities by 33%.[26]
A 2018 study found that traffic calming measures in Portland, Oregon reduced excessive speeds, reduced daily traffic volume by 16% and increased home prices by 1%.[27]
Example in Oakland, California
The Harrison and 23rd Street Crash Response Project was proposed by the Oakland Department of Transportation (OakDOT) in June 2017 after the death of 68-year-old Oakland resident Robert Bennett (Ferrara 2017).
68-year-old pedestrian Robert Bennett was killed by an unidentified driver turning left from 23rd Street onto Harrison Street (Tolan 2017). The crash was indicative of inadequate safety measures to protect pedestrians at the intersection, especially considering that Harrison Street runs adjacent to Oakland's largest senior center.
In response to the fatality and the subsequent protests by Walk Oakland Bike Oakland, Oakland's Department of Transportation (OakDOT) committed to make Harrison Street more conducive to pedestrians (Tadayon 2017). With a Traffic Engineering Technical Assistance Program grant from the Metropolitan Transportation Commission, the City of Oakland implemented changes that were part of the Vision Zero immediate crash response initiative. Harrison Street was historically a high injury corridor with a concentration of severe traffic-related collisions with "1.8 KSI (kills & serious injuries) per mile" and high speeds with 60% of vehicles over the legal limit (Harrison & 23rd St Crash Response). This problem was exacerbated by the six lanes of traffic on Harrison Street.
In addition to eliminating the left turn from 23rd Street onto Harrison Street, OakDOT's traffic calming scheme notably reduced the number of lanes on Harrison St from six to four. In place of the omitted lanes of traffic, OakDOT elected to add bicycle lanes in each direction and larger median (Harrison & 23rd St Crash Response). The revised median protects pedestrians by giving them more space to stand and added protection from permanent bollards while incorporating curbed ramps to ensure that they can be used by individuals with wheelchairs and strollers. Moreover, bulb-outs were added on each corner of the intersection to slow traffic while protecting pedestrians by reducing the amount of roadway they must cross. The enlarged median and bulb-outs were also painted bright purple making it more visible to drivers with the intention of reducing confusion and effectively making the intersection safer for pedestrians.
Since July 2017, OakDOT added to the original edition of the initiative. The revised edition, supported by the Lakeside Family Streets project and completed in 2019, replaced on street parking on Harrison Street between 20th Street to 27th Street with protected bike lanes. In conjunction with the additional bike lanes, the plan includes protected intersections for cyclists along Harrison Street to omit the need for dangerous mixing zones.
Japan
Various forms of traffic calming are used in Japanese cities, particularly in large cities like Tokyo and Yokohama. Tokyo's narrow streets force automobiles and pedestrians to be close to one another; a common traffic calming technique in Tokyo is to change the surface material and/or texture of the shoulder of narrow roads,[28] which helps define the boundary between cars and pedestrians, while allowing cars to use those spaces to pass oncoming traffic.
Reception and evaluation
A Cochrane Review of studies found that there is evidence to demonstrate the efficacy of traffic calming measures in reducing traffic-related injuries and may even reduce deaths. However, the review found that more evidence is needed to demonstrate its efficacy in low income countries.[29]
Gallery
-
Curb extension at a mid-block pedestrian crossing
-
Chicane on a one-lane road
-
A diverter replaces a crossroads with two curves, forcing motor vehicles to turn.
-
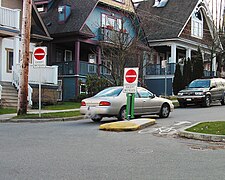
A motorist disregards a directional closure (a two-lane roadway with one terminus converted to one-way access).
-
A (rather wide) speed table
-
A tree being used to slow down car drivers
See also
References
This section includes a list of references, related reading, or external links, but its sources remain unclear because it lacks inline citations. (September 2020) |
- ^ Caves, R. W. (2004). Encyclopedia of the City. Routledge. p. 674. ISBN 978-0415862875.
- ^ Hass-Klau, Carmen (February 1985). "Trying to calm the motor car". Town and Country Planning: 51–53.
- ^ Appleyard, Donald (1981). Livable Streets. CA USA: University of California Berkeley.
- ^ Hass-Klau, Carmen (1992). Civilised Streets: A Guide to Traffic Calming. Brighton, UK: Environmental and Transport Planning. p. 223. ISBN 0-9519620-0-0.
- ^ Learning from Hilden’s Successes Archived 29 October 2008 at the Wayback Machine, Rod King, Warrington Cycle Campaign, August 2004 (Accessed 24 January 2007)
- ^ Home Zones briefing sheet, Robert Huxford, Proceedings, Institution of Civil Engineers, Transport, 135, 45-46, February 1999
- ^ Road Narrowings and Pinch Points Archived 6 December 2007 at the Wayback Machine An Information Sheet, Galway Cycling Campaign, February 2001
- ^ Cyclists at Road Narrowings Archived 9 June 2016 at the Wayback Machine, by Howard Peel, The Bike Zone. (Accessed 27 January 2007)
- ^ Fitzgerald & Halliday, Inc. Traffic Calming Resource Guide (PDF). South Central Regional Council of Governments. Archived (PDF) from the original on 4 March 2016. Retrieved 12 November 2014.
- ^ "Bigger Isn't Always Better: Narrow Traffic Lanes Make Cities Safer | TheCityFix". TheCityFix. 6 December 2016. Archived from the original on 18 April 2017. Retrieved 17 April 2017.
- ^ single lane choker Archived 4 April 2018 at the Wayback Machine ITE
- ^ David Hemebrew (22 November 2011). "Speed bumps on the cycle-path". A view from the cycle path. Retrieved 16 December 2022.
- ^ Speed reduction, traffic calming or cycling facilities: a question of what best achieves the goals?, Michael Yeates, Convenor, Cyclists Urban Speed limit Taskforce, Bicycle Federation of Australia, Velomondial Conference Proceedings, Amsterdam 2000
- ^ The Graz traffic calming model and its consequences for cyclists, Manfred Hoenig, Department of transportation, City Council Graz, Velomondial Conference Proceedings, Amsterdam 2000
- ^ "No Need for Speed: 20s Plenty for Us". Streetfilms. 30 August 2010. Archived from the original on 14 June 2013. Retrieved 9 September 2013.
- ^ Hart, Joshua. "Driven To Excess: A Study of Motor Vehicle Impacts on Three Streets in Bristol UK" (PDF). Archived from the original (PDF) on 26 April 2012. Retrieved 27 November 2011.
- ^ Enabling and encouraging people to cycle Archived 22 November 2008 at the Wayback Machine, John Franklin, Paper presented to the Cambridge Cycling Campaign AGM, 5 October 1999
- ^ How to enhance WALking and CYcliNG instead of shorter car trips and to make these modes safer, Deliverable D6 WALCYNG Contract No: UR-96-SC.099, Department of Traffic Planning and Engineering, University of Lund, Sweden 1999
- ^ Gary Cleland (14 March 2008). "Speed cameras collect over £100m in fines". The Daily Telegraph. Retrieved 18 March 2008.[dead link]
- ^ Devon County Council, 1991, "Traffic Calming Guidelines"
- ^ "Active travel fund: local transport authority allocations". GOV.UK. 20 May 2022. Retrieved 7 December 2022.
- ^ "Local councils advised to push ahead with traffic reduction schemes". the Guardian. 13 November 2020. Retrieved 7 December 2022.
- ^ Aldred, Rachel; Goodman, Anna (10 September 2020). "Low Traffic Neighbourhoods, Car Use, and Active Travel: Evidence from the People and Places Survey of Outer London Active Travel Interventions | Published in Findings". Findings. Findingspress.org. doi:10.32866/001c.17128. Archived from the original on 29 April 2021. Retrieved 25 November 2021.
- ^ "Guidelines on Traffic Calming for Towns and Villages on National Routes" (PDF). National Roads Authority. Retrieved 24 November 2023.
- ^ "Evaluation of Traffic Calming Schemes Implemented from 1997 to 2002" (PDF). National Roads Authority. Retrieved 24 November 2023.
- ^ "Vision Zero SF - How Are We Doing?". 13 May 2015. Archived from the original on 19 January 2021. Retrieved 29 October 2018.
- ^ Polloni, Stefano (13 November 2018). "Traffic calming and neighborhood livability: Evidence from housing prices in Portland". Regional Science and Urban Economics. 74: 18–37. doi:10.1016/j.regsciurbeco.2018.11.004. ISSN 0166-0462. S2CID 157921339.
- ^ "(25) Traffic calming in Tokyo 交通静穏化". the tokyo files: urban design 東京の都市デザイン. 7 March 2017. Archived from the original on 11 November 2020. Retrieved 18 February 2018.
- ^ Bunn, F; Collier, T; Frost, C; Ker, K; Steinbach, R; Roberts, I; Wentz, R (2003). "Area-wide traffic calming for preventing traffic related injuries". Cochrane Database of Systematic Reviews. 2010 (1): CD003110. doi:10.1002/14651858.CD003110. hdl:2299/5206. PMC 8693445. PMID 12535454.
"Department of Transportation's Strategic Plan – January 2019 Update." City of Oakland, January 29, 2019. https://www.oaklandca.gov/resources/department-of-transportation-a- strategic-plan. "Harrison Street/Oakland Avenue Traffic Calming Study Project." Kimley-Horn and Associates, inc, June 18, 2007. "Harrison & 23rd St Crash Response." City of Oakland. Accessed November 2, 2019. https://www.oaklandca.gov/projects/harrison-23rd-st-crash-response. Rudick, Roger. "Eyes on the Street: Lake Merritt BART Intersection Improvements." Streetsblog San Francisco, May 31, 2019. https://sf.streetsblog.org/2019/05/31/eyes-on-the-street-lake-merritt-bart- intersection-improvements/. Rudick, Roger. "Oakland Bollard-Izes Protected Intersections at Lake Merritt." Streetsblog San Francisco, July 1, 2019. https://sf.streetsblog.org/2019/07/01/oakland-bollard-izes-protected- intersections-at-lake-merritt/. Rudick, Roger. "Protected Intersection Update: What's Next?" Streetsblog San Francisco, November 2, 2019. https://sf.streetsblog.org/2019/10/31/protected-intersection-update-whats- next/. Tadayon, Ali. "Quick Fixes Make Oakland Street Where Pedestrian Was Killed Safer; Redesign Underway." East Bay Times. East Bay Times, October 1, 2017. https://www.eastbaytimes.com/2017/09/29/quick-fixes-make-street- where-pedestrian-was-killed-safer-redesign-underway/. Tolan, Casey, and Harry Harris. "Man Killed in Hit-Run near Lake Merritt Ran Social Justice Firm." East Bay Times. East Bay Times, June 5, 2017. https://www.eastbaytimes.com/2017/06/02/oakland-pedestrian-critically- injured-by-hit-run-driver-near-lake-merritt/.
External links
![]() Media related to Traffic calming at Wikimedia Commons
Media related to Traffic calming at Wikimedia Commons
- Traffic calming in an Ontario, Canada community
- Traffic Calming ePrimer (Office of Safety, U.S. Federal Highway Administration)

