Winnebago County, Illinois
This article includes a list of general references, but it lacks sufficient corresponding inline citations. (April 2009) |
Winnebago County | |
|---|---|
 Location within the U.S. state of Illinois | |
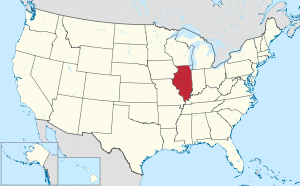
 Illinois's location within the U.S. | |
| Coordinates: 42°20′N 89°10′W / 42.33°N 89.16°W | |
| Country | |
| State | |
| Founded | 1834 |
| Seat | Rockford |
| Area | |
• Total | 519 sq mi (1,340 km2) |
| • Land | 514 sq mi (1,330 km2) |
| • Water | 6 sq mi (20 km2) 1.07% |
| Population (2000) | |
• Total | 278,418 |
| • Density | 540/sq mi (209/km2) |
| Website | www |
Winnebago County is a county located in the U.S. state of Illinois. As of 2000, the population was 278,418. Its county seat is Rockford, IllinoisTemplate:GR.
Winnebago County is part of the Rockford, Illinois, Metropolitan Statistical Area.
Geography
According to the U.S. Census Bureau, the county has a total area of 519 square miles (1,345 km²), of which, 514 square miles (1,331 km²) of it is land and 6 square miles (14 km²) of it (1.07%) is water.
Adjacent counties
- Rock County, Wisconsin (north)
- Boone County (east)
- DeKalb County (southeast)
- Ogle County (south)
- Stephenson County (west)
- Green County, Wisconsin (northwest)
History
Winnebago County was formed in 1836 out of Jo Daviess and LaSalle Counties. It was named for the Winnebago Tribe of Native Americans.
Demographics
As of the censusTemplate:GR of 2000, there were 278,418 people, 107,980 households, and 73,642 families residing in the county. The population density was 542 people per square mile (209/km²). There were 114,404 housing units at an average density of 223 per square mile (86/km²). The racial makeup of the county was 82.46% White, 10.53% Black or African American, 0.29% Native American, 1.72% Asian, 0.04% Pacific Islander, 3.11% from other races, and 1.86% from two or more races. 6.90% of the population were Hispanic or Latino of any race. 20.8% were of German, 9.2% Swedish, 8.9% Irish, 7.3% Italian, 6.6% English and 6.1% American ancestry according to Census 2000.
There were 107,980 households out of which 32.90% had children under the age of 18 living with them, 52.30% were married couples living together, 11.80% had a female householder with no husband present, and 31.80% were non-families. 26.30% of all households were made up of individuals and 9.60% had someone living alone who was 65 years of age or older. The average household size was 2.53 and the average family size was 3.06.
In the county the population was spread out with 26.40% under the age of 18, 8.40% from 18 to 24, 29.80% from 25 to 44, 22.70% from 45 to 64, and 12.70% who were 65 years of age or older. The median age was 36 years. For every 100 females there were 95.80 males. For every 100 females age 18 and over, there were 92.60 males.
The median income for a household in the county was $43,886, and the median income for a family was $52,456. Males had a median income of $40,289 versus $25,942 for females. The per capita income for the county was $21,194. About 6.90% of families and 9.60% of the population were below the poverty line, including 12.90% of those under age 18 and 6.80% of those age 65 or over.
Present County Government Representation
Winnebago County is comprised by the following districts represented in 2009-2010 by the following individuals listed along with their political affiliation[1]:
District 1. Randal Olson (R) & Tom Owens (R)[2]:
2. Steve Schultz (R) & David Yeske (R)[3]:
3. Doug Aurand (D) & Kyle Logan (R)[4]:
4. Dave Fiduccia (R) & Dianne Parvin (R)[5]:
5. Paul Gorski (D) & Peter Mackay (R)[6]:
6. Pearl Hawks (D) & Dorothy Redd (D)[7]:
7. Angie Goral (D) & Dave Tassoni (D)[8]:
8. Kay Mullins (R) & Melvin Paris (D)[9]:
9. Ted Biondo (R) & Fred Wescott (R)[10]:
10. John Eckberg (R) & Bob Kinnison (R)[11]:
11. Karen Elyea (D) & Karen Hoffman (D)[12]:
12. George Anne Duckett (D) & L.C. Wilson (D)[13]:
13. Bob Hastings (D) & Rick Pollack (R)[14]:
14. Frank Gambino (R) & John Sweeney (R)[15]:
Townships
Winnebago County is divided into these townships:
Cities and towns
See also
References


