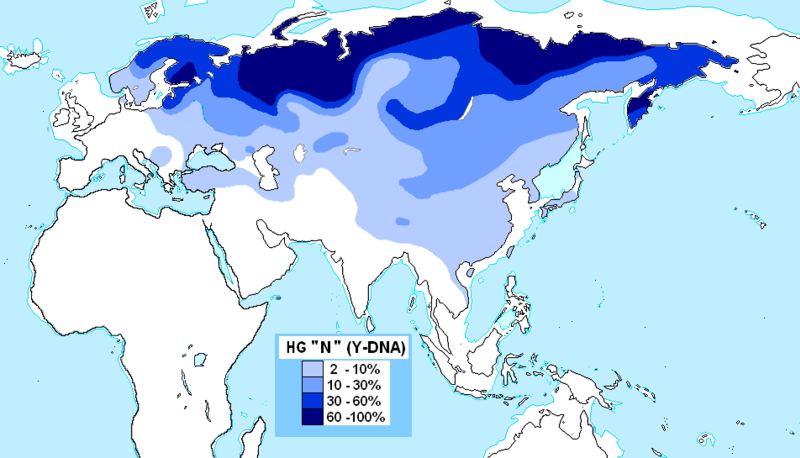
File:Haplogrupo N (ADN-Y).PNG
Appearance

Size of this preview: 800 × 458 pixels. Other resolutions: 320 × 183 pixels | 640 × 366 pixels | 953 × 545 pixels.
Original file (953 × 545 pixels, file size: 76 KB, MIME type: image/png)
File history
Click on a date/time to view the file as it appeared at that time.
| Date/Time | Thumbnail | Dimensions | User | Comment | |
|---|---|---|---|---|---|
| 17:40, 28 January 2020 | 1,232 × 498 (112 KB) | LenguaMapa | see talk, some further corrections | ||
| 21:18, 19 January 2020 | 1,232 × 498 (114 KB) | LenguaMapa | Reverted to version as of 00:37, 29 December 2019 (UTC) | ||
| 17:45, 11 January 2020 | 1,232 × 498 (113 KB) | LenguaMapa | Reverted to version as of 20:11, 22 December 2019 (UTC) | ||
| 00:37, 29 December 2019 | 1,232 × 498 (114 KB) | LenguaMapa | Reverted to version as of 00:19, 28 December 2019 (UTC) | ||
| 01:18, 28 December 2019 |  | 953 × 551 (71 KB) | LenguaMapa | Reverted to version as of 16:22, 25 December 2019 (UTC) | |
| 00:19, 28 December 2019 | 1,232 × 498 (114 KB) | LenguaMapa | Reverted to version as of 09:37, 25 December 2019 (UTC) ... well the study say 2% for the whole population of northern Canada | ||
| 16:22, 25 December 2019 |  | 953 × 551 (71 KB) | LenguaMapa | Reverted to version as of 11:57, 17 November 2019 (UTC) for now, the samples in America are only found in one group and far below 2%. Actually they are only 2% in the specific group, thus i am reverting my former edit | |
| 09:37, 25 December 2019 | 1,232 × 498 (114 KB) | LenguaMapa | Reverted to version as of 19:30, 28 November 2019 (UTC) this one was a mistake (N is in average 4-7% in Austria/Hungary and 8% in Afghanistan/northern India) | ||
| 20:11, 22 December 2019 | 1,232 × 498 (113 KB) | LenguaMapa | frequency correction on europe and pakistan, (while some regions have more than 2% the average is less. certain groups can be shown, but seem in this case to be misleading) | ||
| 19:30, 28 November 2019 | 1,232 × 498 (114 KB) | LenguaMapa | added northern america (Taicho tribes (a Na-Dene speaking population in northern Canada) with an average of 2%, added southeastern Tibetans with average 36% |
File usage
The following 4 pages use this file:
Global file usage
The following other wikis use this file:
- Usage on azb.wikipedia.org
- Usage on be-tarask.wikipedia.org
- Usage on es.wikipedia.org
- Usage on fa.wikipedia.org
- Usage on fi.wikipedia.org
- Usage on fr.wikipedia.org
- Usage on ja.wikipedia.org
- Usage on ko.wikipedia.org
- Usage on lv.wikipedia.org
- Usage on mk.wikipedia.org
- Usage on no.wikipedia.org
- Usage on pl.wikipedia.org
- Usage on pt.wikipedia.org
- Usage on ru.wikipedia.org
- Usage on sk.wikipedia.org
- Usage on sr.wikipedia.org
- Usage on sv.wikipedia.org
- Usage on tr.wikipedia.org
- Usage on uk.wikipedia.org
- Usage on zh.wikipedia.org


