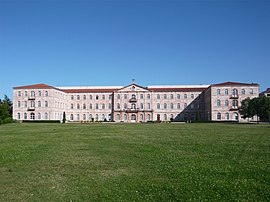
Caluire-et-Cuire
Appearance
Caluire-et-Cuire | |
|---|---|
 City hall | |
| Coordinates: 45°47′43″N 4°50′50″E / 45.7953°N 4.8472°E | |
| Country | France |
| Region | Auvergne-Rhône-Alpes |
| Metropolis | Lyon Metropolis |
| Arrondissement | Lyon |
| Government | |
| • Mayor (2020–2026) | Philippe Cochet (LR) |
Area 1 | 10.45 km2 (4.03 sq mi) |
| Population (2022)[1] | 43,479 |
| • Density | 4,200/km2 (11,000/sq mi) |
| Time zone | UTC+01:00 (CET) |
| • Summer (DST) | UTC+02:00 (CEST) |
| INSEE/Postal code | 69034 /69300 |
| Elevation | 165–275 m (541–902 ft) |
| 1 French Land Register data, which excludes lakes, ponds, glaciers > 1 km2 (0.386 sq mi or 247 acres) and river estuaries. | |
Caluire-et-Cuire (French pronunciation: [kalɥiʁ e kɥiʁ] ⓘ; Template:Lang-frp) is a commune in the Metropolis of Lyon in Auvergne-Rhône-Alpes region in eastern France.
It is the fifth-largest suburb of the city of Lyon, and lies 4 km north-by-east of Lyon.[2]
Population
|
| ||||||||||||||||||||||||||||||||||||||||||||||||||||||||||||||||||||||||||||||||||||||||||||||||||||||||||||||||||
| |||||||||||||||||||||||||||||||||||||||||||||||||||||||||||||||||||||||||||||||||||||||||||||||||||||||||||||||||||
| Source: EHESS[3] and INSEE (1968-2017)[4] | |||||||||||||||||||||||||||||||||||||||||||||||||||||||||||||||||||||||||||||||||||||||||||||||||||||||||||||||||||
Neighbourhoods
- Le Bourg
- Vassieux
- Cuire-le-Bas (quarter)
- Cuire-le-Haut (quarter)
- Saint-Clair
- Le Vernay
- Montessuy
- Bissardon
See also
References
- ^ "Populations de référence 2022" (in French). The National Institute of Statistics and Economic Studies. 19 December 2024.
- ^ Chisholm, Hugh, ed. (1911). . Encyclopædia Britannica (11th ed.). Cambridge University Press.
- ^ Des villages de Cassini aux communes d'aujourd'hui: Commune data sheet Caluire-et-Cuire, EHESS (in French).
- ^ Population en historique depuis 1968, INSEE
External links
- Town council website (in French)
Wikimedia Commons has media related to Caluire-et-Cuire.


