New Jersey's 4th congressional district
| New Jersey's 4th congressional district | |
|---|---|
Interactive map of district boundaries since January 3, 2023 | |
| Representative | |
| Distribution |
|
| Population (2023) | 795,843 |
| Median household income | $93,402[1] |
| Ethnicity |
|
| Cook PVI | R+14[2] |
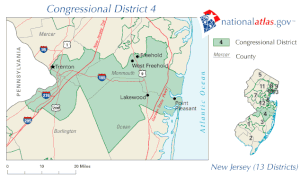
New Jersey's 4th congressional district is a congressional district that stretches along the New Jersey Shore. It has been represented by Republican Chris Smith since 1981, the second-longest currently serving member of the US House of Representatives and the longest serving member of Congress from New Jersey in history.
Although the 4th district had a presence in Mercer County for decades, it lost its two towns in the county (Hamilton and Robbinsville) following the redistricting process in late 2021, which was based on the 2020 census. The district is currently contained to Monmouth County and Ocean County. With a Cook Partisan Voting Index rating of R+14, it is the most Republican district in New Jersey,[2] and it is also the only one that did not elect a Democrat since 2018.[3]
Counties and municipalities in the district

For the 118th and successive Congresses (based on redistricting following the 2020 Census), the district contains all or portions of two counties and 40 municipalities.[4]
Municipalities in the district are:[5][6]
Monmouth County (19)
- Avon-By-The-Sea, Belmar, Brielle, Colts Neck, Eatontown, Farmingdale, Freehold Township (part; also 3rd), Howell, Lake Como, Manasquan, Middletown (part; also 6th; includes Lincroft, Navesink, and part of Belford, Fairview, North Middletown, and Port Monmouth), Ocean Township, Sea Girt, Shrewsbury, Shrewsbury Township, Spring Lake, Spring Lake Heights, Tinton Falls, Wall
Ocean County (21)
- Bay Head, Beachwood, Berkeley Township (part; also 2nd; includes Holiday City-Berkeley, Holiday City South, Holiday Heights, and Silver Ridge), Brick, Island Heights, Jackson, Lacey Township (part; also 2nd; includes Forked River), Lakehurst, Lakewood, Lavallette, Manchester Township, Mantoloking, Ocean Gate, Pine Beach, Point Pleasant Beach, Point Pleasant, Plumsted, Seaside Heights, Seaside Park, South Toms River, Toms River
Election results in statewide races
| Year | Office | Results |
|---|---|---|
| 2000 | President | Gore 50 - 46% |
| 2004 | President | Bush 56 - 44% |
| 2008 | President | McCain 52 - 47% |
| 2012 | President | Romney 54 - 45% |
| 2016 | President | Trump 56 - 41% |
| 2017 | Governor | Guadagno 56% - 42% |
| 2020 | President | Trump 55 - 44% |
| 2020 | Senate | Mehta 55.0% - 43.4% |
| 2021 | Governor | Ciattarellli 60% - 40% |
List of members representing the district
Recent election results
2012
| Party | Candidate | Votes | % | |
|---|---|---|---|---|
| Republican | Chris Smith (incumbent) | 195,146 | 63.7 | |
| Democratic | Brian Froelich | 107,992 | 35.3 | |
| Independent | Leonard Marshall | 3,111 | 1.0 | |
| Total votes | 306,247 | 100.0 | ||
| Republican hold | ||||
2014
| Party | Candidate | Votes | % | |
|---|---|---|---|---|
| Republican | Chris Smith (incumbent) | 118,826 | 68.0 | |
| Democratic | Ruben M. Scolavino | 54,415 | 31.1 | |
| Independent | Scott Neuman | 1,608 | 0.9 | |
| Total votes | 174,849 | 100.0 | ||
| Republican hold | ||||
2016
| Party | Candidate | Votes | % | |
|---|---|---|---|---|
| Republican | Chris Smith (incumbent) | 211,992 | 63.7 | |
| Democratic | Lorna Phillipson | 111,532 | 33.5 | |
| Independent | Hank Schroeder | 5,840 | 1.8 | |
| Libertarian | Jeremy Marcus | 3,320 | 1.0 | |
| Total votes | 332,684 | 100.0 | ||
| Republican hold | ||||
2018
| Party | Candidate | Votes | % | |
|---|---|---|---|---|
| Republican | Chris Smith (incumbent) | 163,065 | 55.4 | |
| Democratic | Joshua Welle | 126,766 | 43.1 | |
| Libertarian | Michael Rufo | 1,387 | 0.5 | |
| Independent | Ed Stackhouse | 1,064 | 0.4 | |
| Independent | Brian Reynolds | 851 | 0.3 | |
| Independent | Felicia Stoler | 844 | 0.3 | |
| Independent | Allen Yusufov | 371 | 0.1 | |
| Total votes | 294,348 | 100.0 | ||
| Republican hold | ||||
2020
| Party | Candidate | Votes | % | |
|---|---|---|---|---|
| Republican | Chris Smith (incumbent) | 254,103 | 59.9 | |
| Democratic | Stephanie Schmid | 162,420 | 38.3 | |
| Independent | Hank Schroeder | 3,195 | 0.7 | |
| Libertarian | Michael Rufo | 2,583 | 0.6 | |
| Independent | Andrew Pachuta | 2,067 | 0.5 | |
| Total votes | 424,368 | 100.0 | ||
| Republican hold | ||||
2022
| Party | Candidate | Votes | % | |
|---|---|---|---|---|
| Republican | Chris Smith (incumbent) | 173,288 | 66.9 | |
| Democratic | Matthew Jenkins | 81,233 | 31.4 | |
| Libertarian | Jason Cullen | 1,902 | 0.7 | |
| Independent | David Schmidt | 1,197 | 0.5 | |
| Independent | Hank Schroeder | 905 | 0.3 | |
| Independent | Pam Daniels | 437 | 0.2 | |
| Total votes | 258,962 | 100.0 | ||
| Republican hold | ||||
References
- ^ "My Congressional District".
- ^ a b "2022 Cook PVI: District Map and List". July 12, 2022.
- ^ "New Jersey Congressional Districts: 2022-2031" (PDF). New Jersey Redistricting Commission. December 22, 2021. Retrieved December 29, 2021.
- ^ [1], New Jersey Redistricting Commission, December 23, 2021. Accessed November 5, 2022.
- ^ District, Chris Smith (New Jersey politician). Accessed June 15, 2016.
- ^ Plan Components Report, New Jersey Redistricting Commission, December 23, 2011. Accessed November 6, 2016.
- ^ "Election Information" (PDF). NJ Department of State. November 6, 2012. Retrieved March 9, 2018.
- ^ "Election Information" (PDF). NJ Department of State. December 2, 2014. Retrieved February 8, 2020.
- ^ "Election Information" (PDF). NJ Department of State. November 8, 2016. Retrieved December 8, 2016.
- ^ Johnson, Cheryl L. (February 28, 2019). "Statistics of the Congressional Election of November 6, 2018". Clerk of the U.S. House of Representatives. Retrieved April 27, 2019.
- ^ "Official General Election Results: U.S. House of Representatives" (PDF). New Jersey Department of Elections. Retrieved December 7, 2020.
- ^ "2022 Official General Election Results: U.S. House of Representatives" (PDF). New Jersey Department of State - Division of Elections. Retrieved December 7, 2022.
- Martis, Kenneth C. (1989). The Historical Atlas of Political Parties in the United States Congress. New York: Macmillan Publishing Company.
- Martis, Kenneth C. (1982). The Historical Atlas of United States Congressional Districts. New York: Macmillan Publishing Company.
- Congressional Biographical Directory of the United States 1774–present
- Congressional districts of New Jersey
- Mercer County, New Jersey
- Monmouth County, New Jersey
- Ocean County, New Jersey
- Constituencies established in 1799
- 1799 establishments in New Jersey
- Constituencies disestablished in 1801
- 1801 disestablishments in New Jersey
- Constituencies established in 1843
- 1843 establishments in New Jersey


