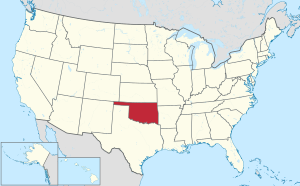
Stephens County, Oklahoma
Stephens County | |
|---|---|
 Location within the U.S. state of Oklahoma | |
 Oklahoma's location within the U.S. | |
| Coordinates: 34°29′N 97°52′W / 34.48°N 97.86°W | |
| Country | |
| State | |
| Seat | Duncan |
| Area | |
• Total | 891 sq mi (2,310 km2) |
| • Land | 874 sq mi (2,260 km2) |
| • Water | 17 sq mi (40 km2) 1.92% |
| Population | |
• Estimate (2012) | 44,779 |
| • Density | 50/sq mi (20/km2) |
Stephens County is a county located in the U.S. state of Oklahoma. As of 2010, the population was 45,048. Its county seat is DuncanTemplate:GR.
Geography
According to the U.S. Census Bureau, the county has a total area of 2,308 km² (891 mi²). 2,264 km² (874 mi²) of it is land and 44 km² (17 mi²) of it (1.92%) is water.
Adjacent counties
- Grady County (north)
- Garvin County (northeast)
- Carter County (southeast)
- Jefferson County (south)
- Cotton County (southwest)
- Comanche County (northwest)
Demographics
| Census | Pop. | Note | %± |
|---|---|---|---|
| 1910 | 22,252 | — | |
| 1920 | 24,692 | 11.0% | |
| 1930 | 33,069 | 33.9% | |
| 1940 | 31,090 | −6.0% | |
| 1950 | 34,071 | 9.6% | |
| 1960 | 37,990 | 11.5% | |
| 1970 | 35,902 | −5.5% | |
| 1980 | 43,419 | 20.9% | |
| 1990 | 42,299 | −2.6% | |
| 2000 | 43,182 | 2.1% | |
| 2010 | 45,048 | 4.3% | |

As of the censusTemplate:GR of 2000, there were 43,182 people, 17,463 households, and 12,590 families residing in the county. The population density was 19/km² (49/mi²). There were 19,854 housing units at an average density of 9/km² (23/mi²). The racial makeup of the county was 88.37% White, 2.20% Black or African American, 4.92% Native American, 0.30% Asian, 0.03% Pacific Islander, 1.44% from other races, and 2.74% from two or more races. 3.96% of the population were Hispanic or Latino of any race.
There were 17,463 households out of which 30.40% had children under the age of 18 living with them, 59.50% were married couples living together, 9.20% had a female householder with no husband present, and 27.90% were non-families. 25.30% of all households were made up of individuals and 12.80% had someone living alone who was 65 years of age or older. The average household size was 2.44 and the average family size was 2.91.
In the county, the population was spread out with 24.60% under the age of 18, 7.80% from 18 to 24, 25.10% from 25 to 44, 24.00% from 45 to 64, and 18.50% who were 65 years of age or older. The median age was 40 years. For every 100 females there were 93.70 males. For every 100 females age 18 and over, there were 89.70 males.
The median income for a household in the county was $30,709, and the median income for a family was $36,371. Males had a median income of $30,428 versus $20,055 for females. The per capita income for the county was $16,357. About 11.60% of families and 14.60% of the population were below the poverty line, including 19.50% of those under age 18 and 11.90% of those age 65 or over.
| Voter Registration and Party Enrollment as of January 15, 2012[1] | ||||||||||||
|---|---|---|---|---|---|---|---|---|---|---|---|---|
| Party | Number of Voters | Percentage | Democratic | 13,761 | 54.39% | Republican | 9,288 | 36.71% | Unaffiliated | 2,251 | 8.90% | |
| Total | 25,300 | 100% | ||||||||||
Politics
| Year | Republican | Democrat |
|---|---|---|
| 2008 | 76.03% 14,394 | 23.97% 4,538 |
| 2004 | 71.22% 13,646 | 28.78% 5,515 |
| 2000 | 62.10% 10,860 | 36.98% 6,467 |
Cities and towns
See also
References
- ^ http://www.ok.gov/elections/documents/reg_0112.pdf
- ^ "Dave Leip's Atlas of U.S. Presidential Elections". Retrieved 2011-06-11.

