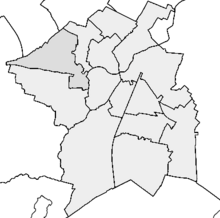
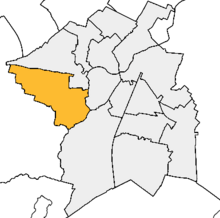
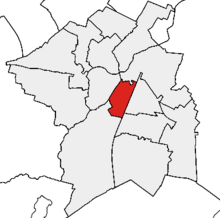
2012 Cambridge City Council election

Elections for Cambridge City Council (in Cambridge, England) were held on Thursday 3 May 2012. One third of the council was up for election and the Liberal Democrats lost overall control of the council, to No Overall Control.[1]
Election result

| Party | Seats | Gains | Losses | Net gain/loss | Seats % | Votes % | Votes | +/− | |
|---|---|---|---|---|---|---|---|---|---|
| Labour | 8 | 4 | 0 | +4 | 57.1 | 42.7 | 12,353 | +8.4 | |
| Liberal Democrats | 4 | 0 | 4 | -4 | 28.6 | 26.1 | 7,560 | -1.7 | |
| Conservative | 1 | 1 | 0 | +1 | 7.1 | 15.4 | 4,464 | -5.8 | |
| Green | 0 | 0 | 1 | -1 | 0.0 | 10.1 | 2,925 | -5.0 | |
| Independent | 1 | 0 | 0 | 0 | 7.1 | 3.2 | 925 | +2.8 | |
| Cambridge Socialists | 0 | 0 | 0 | 0 | 0.0 | 1.6 | 457 | +0.6 | |
| UKIP | 0 | 0 | 0 | 0 | 0.0 | 0.4 | 129 | -0.1 | |
| United People's Party | 0 | 0 | 0 | 0 | 0.0 | 0.4 | 105 | +0.4 | |
This result has the following consequences for the total number of seats on the Council after the elections:
| Party | Previous council | New council | |||
|---|---|---|---|---|---|
| style="background-color: Template:Liberal Democrats (UK)/meta/color; width: 3px;" | | Liberal Democrats | 25 | 21 | ||
| style="background-color: Template:Labour Party (UK)/meta/color; width: 3px;" | | Labour | 15 | 19 | ||
| style="background-color: Template:Green Party of England and Wales/meta/color; width: 3px;" | | Green | 1 | 0 | ||
| style="background-color: Template:Independent (politician)/meta/color; width: 3px;" | | Independent | 1 | 1 | ||
| style="background-color: Template:Conservative Party (UK)/meta/color; width: 3px;" | | Conservatives | 0 | 1 | ||
| style="background-color: Template:Cambridge Socialists/meta/color; width: 3px;" | | Cambridge Socialists | 0 | 0 | ||
| style="background-color: Template:United Kingdom Independence Party/meta/color; width: 3px;" | | UKIP | 0 | 0 | ||
| style="background-color: Template:United People's Party/meta/color; width: 3px;" | | United People's Party | 0 | 0 | ||
| Total | 42 | 42 | |||
| Working majority | 8 | 0 | |||
The Liberal Democrats retained control of the Council, with the casting vote of the Mayor, though they lost a majority.[4][5] The overall turnout was 32.2%,[6]
Ward results
Note: in results where, in previous elections, two seats were up for election the party share of the vote is based on an average for those candidates who stood for that particular party in the election.
Unless stated otherwise, changes in party vote is in comparison with the 2011 Cambridge City Council election results.[7]
Abbey ward
Councillor Margaret Wright retired her Abbey seat. William Birkin was aiming to retain the vacated seat for the Greens.

| Party | Candidate | Votes | % | ±% | |
|---|---|---|---|---|---|
| Labour | Richard Johnson | 963 | 54.4 | +12.6 | |
| Green | William Birkin | 423 | 23.9 | −7.6 | |
| Conservative | Timothy Haire | 219 | 12.4 | −4.0 | |
| Liberal Democrats | Christopher Brown | 165 | 9.3 | −1.0 | |
| Majority | 540 | 30.5 | +20.2 | ||
| Rejected ballots | 16 | ||||
| Turnout | 1770 | 26.3 | −11.2 | ||
| Labour gain from Green | Swing | +10.1 | |||
Arbury ward
Councillor Mike Todd-Jones was defending his Arbury seat for the Labour and Co-operative Party.

| Party | Candidate | Votes | % | ±% | |
|---|---|---|---|---|---|
| Labour | Mike Todd-Jones | 1,322 | 59.9 | +19.4 | |
| Liberal Democrats | Rhodri James | 417 | 18.9 | −12.5 | |
| Conservative | Ali Meftah | 237 | 10.7 | −3.1 | |
| Green | Stephen Lawrence | 232 | 10.5 | −1.1 | |
| Majority | 905 | 41.0 | +31.9 | ||
| Rejected ballots | 21 | ||||
| Turnout | 2208 | 32.7 | −15.1 | ||
| Labour hold | Swing | +16.0 | |||
Castle ward
Councillor John Hipkin was defending his Castle seat as an independent candidate. Changes in vote is in comparison to 2008, when John Hipkin's seat was last contested.[8]

| Party | Candidate | Votes | % | ±% | |
|---|---|---|---|---|---|
| Independent | John Hipkin | 925 | 49.5 | +10.5 | |
| Labour | Ashley Walsh | 330 | 17.7 | +7.4 | |
| Liberal Democrats | Alan Levy | 275 | 14.7 | −17.7 | |
| Conservative | Nikesh Pandit | 173 | 9.3 | −2.4 | |
| Green | Jack Toye | 164 | 8.8 | +2.2 | |
| Majority | 595 | 31.9 | +25.3 | ||
| Rejected ballots | 5 | ||||
| Turnout | 1867 | ||||
| Independent hold | Swing | +1.6 | |||
Cherry Hinton ward
Councillor Robert Dryden was defending his Cherry Hinton seat for Labour.

| Party | Candidate | Votes | % | ±% | |
|---|---|---|---|---|---|
| Labour | Robert Dryden | 1556 | 73.2 | +22.8 | |
| Conservative | Angela Ozturk | 385 | 18.1 | −11.4 | |
| Liberal Democrats | Keith Edkins | 185 | 8.7 | +1.1 | |
| Majority | 1171 | 55.1 | +35.4 | ||
| Rejected ballots | 16 | ||||
| Turnout | 2126 | ||||
| Labour hold | Swing | +17.1 | |||
Coleridge ward
Councillor George Owers was defending his Coleridge seat for Labour, having gained it in a 2010 by-election.

| Party | Candidate | Votes | % | ±% | |
|---|---|---|---|---|---|
| Labour | George Owers | 1228 | 59.6 | +12.7 | |
| Conservative | Sam Barker | 422 | 20.5 | −9.8 | |
| Green | Shaun Esgate | 228 | 11.1 | −1.7 | |
| Liberal Democrats | Thomas Yates | 183 | 8.9 | −1.0 | |
| Majority | 806 | 39.1 | +22.5 | ||
| Rejected ballots | 10 | ||||
| Turnout | 2061 | ||||
| Labour hold | Swing | +11.3 | |||
East Chesterton ward
Councillor Roman Znajek retired his East Chesterton seat. Tony Morris was aiming to retain the vacated seat for the Liberal Democrats.

| Party | Candidate | Votes | % | ±% | |
|---|---|---|---|---|---|
| Labour | Margery Abbott | 1,012 | 47.4 | +9.0 | |
| Liberal Democrats | Tony Morris | 438 | 20.5 | −10.4 | |
| Conservative | Kevin Francis | 317 | 14.8 | −1.7 | |
| Green | Peter Pope | 241 | 11.3 | +0.6 | |
| UKIP | Peter Burkinshaw | 129 | 6.0 | +2.4 | |
| Majority | 574 | 26.9 | +19.4 | ||
| Rejected ballots | 10 | ||||
| Turnout | 2137 | ||||
| Labour gain from Liberal Democrats | Swing | +9.7 | |||
King's Hedges ward
Councillor Neil McGovern was defending his King's Hedges seat for the Liberal Democrats.

| Party | Candidate | Votes | % | ±% | |
|---|---|---|---|---|---|
| Labour | Nigel Gawthorpe | 827 | 48.4 | +8.4 | |
| Liberal Democrats | Neil McGovern | 576 | 33.7 | +1.4 | |
| Conservative | Annette Karimi | 199 | 11.7 | −5.6 | |
| United People's Party | Ian Tyes | 105 | 6.2 | +0.1 | |
| Majority | 251 | 14.7 | +7.0 | ||
| Rejected ballots | 12 | ||||
| Turnout | 1707 | ||||
| Labour gain from Liberal Democrats | Swing | +3.5 | |||
Market ward
Councillor Tim Bick was defending his Market seat for the Liberal Democrats.

| Party | Candidate | Votes | % | ±% | |
|---|---|---|---|---|---|
| Liberal Democrats | Tim Bick | 615 | 35.6 | +7.6 | |
| Labour | Noel Kavanagh | 505 | 29.3 | +4.6 | |
| Green | Brett Hughes | 349 | 20.2 | −4.0 | |
| Conservative | Edward Turnham | 257 | 14.9 | −8.1 | |
| Majority | 110 | 6.4 | +3.1 | ||
| Rejected ballots | 13 | ||||
| Turnout | 1726 | ||||
| Liberal Democrats hold | Swing | +1.5 | |||
Newnham ward
Councillor Sian Reid was defending her Newnham seat for the Liberal Democrats.

| Party | Candidate | Votes | % | ±% | |
|---|---|---|---|---|---|
| Liberal Democrats | Sian Reid | 917 | 44.5 | +9.3 | |
| Labour | Sarah Cain | 641 | 31.1 | +4.2 | |
| Conservative | Andre Beaumont | 263 | 12.8 | −9.3 | |
| Green | Billy Aldridge | 241 | 11.7 | −4.1 | |
| Majority | 276 | 13.4 | +5.1 | ||
| Rejected ballots | 14 | ||||
| Turnout | 2062 | ||||
| Liberal Democrats hold | Swing | +2.6 | |||
Petersfield ward
Councillor Gail Marchant-Daisley was defending her Petersfield seat for Labour.

| Party | Candidate | Votes | % | ±% | |
|---|---|---|---|---|---|
| Labour | Gail Marchant-Daisley | 1036 | 56.6 | +7.7 | |
| Liberal Democrats | Zoe O'Connell | 322 | 17.6 | −3.9 | |
| Green | Sandra Billington | 263 | 14.4 | −3.0 | |
| Conservative | Pater Patrick | 209 | 11.4 | −0.9 | |
| Majority | 714 | 39.0 | +11.6 | ||
| Rejected ballots | 10 | ||||
| Turnout | 1830 | ||||
| Labour hold | Swing | +5.8 | |||
Queen Edith's ward
Councillor Amanda Taylor was defending her Queen Edith's seat for the Liberal Democrats.

| Party | Candidate | Votes | % | ±% | |
|---|---|---|---|---|---|
| Labour | Sue Birtles | 1048 | 38.9 | +18.9 | |
| Liberal Democrats | Amanda Taylor | 963 | 35.7 | −5.4 | |
| Conservative | Richard Jeffs | 513 | 19.0 | −6.9 | |
| Green | Martin Lawson | 172 | 6.4 | −6.6 | |
| Majority | 121 | 4.5 | −10.7 | ||
| Rejected ballots | 14 | ||||
| Turnout | 2696 | ||||
| Labour gain from Liberal Democrats | Swing | +12.2 | |||
Romsey ward
Councillor Catherine Smart was defending her Romsey seat for the Liberal Democrats.

| Party | Candidate | Votes | % | ±% | |
|---|---|---|---|---|---|
| Liberal Democrats | Catherine Smart | 1020 | 41.4 | +12.3 | |
| Labour | Rachel Eckersley | 813 | 33.0 | −0.3 | |
| Cambridge Socialists | Tom Woodcock | 457 | 18.5 | +18.5 | |
| Conservative | Philip Salway | 175 | 7.1 | −4.9 | |
| Majority | 207 | 8.4 | +4.2 | ||
| Rejected ballots | 15 | ||||
| Turnout | 2465 | ||||
| Liberal Democrats hold | Swing | +6.3 | |||
Trumpington ward
Councillor Salah Al Bander was defending his Trumpington seat for the Liberal Democrats.

| Party | Candidate | Votes | % | ±% | |
|---|---|---|---|---|---|
| Conservative | Shapour Meftah | 723 | 36.6 | +4.9 | |
| Liberal Democrats | Salah Al Bander | 644 | 32.6 | −3.5 | |
| Labour | Kenny Latunde-Dada | 321 | 16.3 | −1.2 | |
| Green | Ceri Galloway | 287 | 14.5 | −0.1 | |
| Majority | 79 | 4.0 | +0.4 | ||
| Rejected ballots | 8 | ||||
| Turnout | 1975 | ||||
| Conservative gain from Liberal Democrats | Swing | +4.2 | |||
West Chesterton ward
Councillor Ian Nimmo-Smith retired his West Chesterton seat. Mike Pitt was aiming to retain the vacated seat for the Liberal Democrats.

| Party | Candidate | Votes | % | ±% | |
|---|---|---|---|---|---|
| Liberal Democrats | Mike Pitt | 840 | 36.7 | −1.8 | |
| Labour | Mike Sargeant | 751 | 32.8 | +5.6 | |
| Conservative | James Strachan | 372 | 16.3 | −1.8 | |
| Green | Oliver Perkins | 325 | 14.2 | −1.9 | |
| Majority | 89 | 3.9 | −7.4 | ||
| Rejected ballots | 14 | ||||
| Turnout | 2288 | ||||
| Liberal Democrats hold | Swing | -3.7 | |||
References
- ^ http://www.cambridge.gov.uk/ccm/content/council-and-democracy/elections/election-results/2012-elections.en
- ^ http://www.cambridge-news.co.uk/Election/RESULTS-Cambridge-City-Council-02052012.htm,
- ^ http://www.cambridge.gov.uk/public/docs/election-results-may-2012.pdf
- ^ http://www.cambridge-news.co.uk/Home/Lib-Dems-lose-overall-control-of-Cambridge-04052012.htm
- ^ http://www.bbc.co.uk/news/special/vote2012/council/E07000008.stm
- ^ http://www.cambridge.gov.uk/ccm/content/news-releases/may-2012/election-results-2012.en
- ^ http://www.cambridge.gov.uk/democracy/mgElectionElectionAreaResults.aspx?EID=9&RPID=14474950
- ^ http://www.cambridge.gov.uk/ccm/content/council-and-democracy/elections/election-results/2008-elections.en
