1816 United States presidential election
| |||||||||||||||||||||||||||||
217 members of the Electoral College 109 electoral votes needed to win | |||||||||||||||||||||||||||||
|---|---|---|---|---|---|---|---|---|---|---|---|---|---|---|---|---|---|---|---|---|---|---|---|---|---|---|---|---|---|
| Turnout | 16.9%[1] | ||||||||||||||||||||||||||||
| |||||||||||||||||||||||||||||
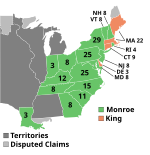
 Presidential election results map. Green denotes states won by Monroe and Light Orange denotes states won by King. Numbers indicate the number of electoral votes cast by each state. | |||||||||||||||||||||||||||||
| |||||||||||||||||||||||||||||
Presidential elections were held in the United States from November 1 to December 4, 1816. In the first election following the end of the War of 1812, Democratic-Republican candidate James Monroe defeated Federalist Rufus King. The election was the last in which the Federalist Party fielded a presidential candidate.
As President James Madison chose to retire after serving two terms, the Democratic-Republicans held a congressional nominating caucus in March 1816. With the support of Madison and former President Thomas Jefferson, Secretary of State Monroe defeated Secretary of War William H. Crawford to win his party's presidential nomination. Governor Daniel D. Tompkins of New York won the Democratic-Republican vice presidential nomination, continuing the party's tradition of balancing a presidential nominee from Virginia with a vice presidential nominee from either New York or New England. The Federalists did not formally nominate a ticket, but Senator King of New York emerged as the de facto Federalist candidate.
The previous four years of American politics were dominated by the effects of the War of 1812. Its drawn outcome and the peace concluded in 1815 were satisfactory to the American people, and the Democratic-Republicans received credit for the results. Federalists were discredited by having opposed the war and by radical rhetoric from New England Federalists at the Hartford Convention. Also, President Madison had adopted certain measures favored by Federalists, including a national bank and protective tariffs. The Federalists had little to campaign on, and Monroe easily won the Electoral College, carrying 16 of the 19 states.
Nominations
Democratic-Republican Party nomination
 | |||||||||||||||||||||||||||||
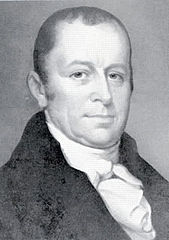
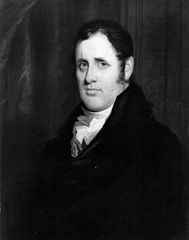
| James Monroe | Daniel D. Tompkins | ||||||||||||||||||||||||||||
|---|---|---|---|---|---|---|---|---|---|---|---|---|---|---|---|---|---|---|---|---|---|---|---|---|---|---|---|---|---|
| for President | for Vice President | ||||||||||||||||||||||||||||
 |
 | ||||||||||||||||||||||||||||
| 7th U.S. Secretary of State (1811–1817) |
4th Governor of New York (1807–1817) | ||||||||||||||||||||||||||||

Withdrew before caucus
Declined to run
James Monroe was the favorite candidate of both former President Jefferson and retiring President Madison. However, Monroe faced stiff competition from Secretary of War William H. Crawford of Georgia. Also, there was widespread sentiment, especially in New York, that it was time to end the Virginia dynasty of presidents, resulting in Daniel D. Tompkins and Simon Snyder, the governors of New York and Pennsylvania respectively, briefly considering running for the presidential nomination. But Monroe's long record of service at home and abroad made him a fitting candidate to succeed Madison. Crawford never formally declared himself a candidate, because he believed that he had little chance against Monroe and feared such a contest might deny him a place in the new cabinet. Tompkins and Snyder realized they had even less chance of beating Monroe to the nomination, and instead positioned themselves to run for the vice presidency. Still, Crawford's supporters posed a significant challenge to Monroe.[2]
Fifty-eight of the Democratic-Republican members of the United States Congress attended the first nominating caucus. A second caucus in March 1816 was attended by one hundred nineteen members of Congress. Monroe won the presidential nomination against Crawford by a vote of sixty-five to fifty-four while Tompkins won the vice-presidential nomination against Snyder by a vote of eighty-five to thirty.[3]
| Presidential Ballot | Vice Presidential Ballot | ||
|---|---|---|---|
| James Monroe | 65 | Daniel D. Tompkins | 85 |
| William H. Crawford | 54 | Simon Snyder | 30 |
Federalist Party candidates
 | |||||||||||||||||||||||||||||
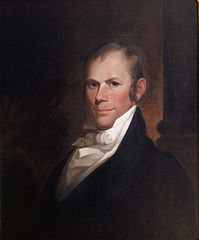
| Rufus King | John Eager Howard | ||||||||||||||||||||||||||||
|---|---|---|---|---|---|---|---|---|---|---|---|---|---|---|---|---|---|---|---|---|---|---|---|---|---|---|---|---|---|
| for President | for Vice President | ||||||||||||||||||||||||||||
 |
 | ||||||||||||||||||||||||||||
| U. S. Senator from New York (1789–1796, 1813–1825) |
U. S. Senator from Maryland (1796–1803) | ||||||||||||||||||||||||||||
In hopes of uniting with disaffected Democratic-Republicans, as they had in the previous election, the Federalists initially planned to hold their own congressional nominating caucus after that of the Democratic-Republicans. With the end of the war and the nomination of Monroe, the Federalists abandoned their hopes of another fusion ticket, and the demoralized party failed to formally nominate a candidate. Senator Rufus King of New York, who had been the party's 1804 and 1808 vice presidential nominee, and who had been nominated for president by a dissident faction of the party in 1812, eventually emerged as the de facto Federalist presidential nominee. Several Federalists would receive electoral votes for vice president, with former Senator John Eager Howard of Maryland receiving the most votes.[4] The Federalists did not formally select a vice-presidential candidate.[5]
General election
Dispute about Indiana
On February 12, 1817, the House and Senate met in joint session to count the electoral votes for president and vice president. The count proceeded without incident until the roll came to the last state to be counted, Indiana. At that point, Representative John W. Taylor of New York objected to the counting of Indiana's votes. He argued that Congress had acknowledged the statehood of Indiana in a joint resolution on December 11, 1816, whereas the ballots of the Electoral College had been cast on December 4, 1816. He claimed that at the time of the balloting, there had been merely a Territory of Indiana, not a State of Indiana. Other representatives contradicted Taylor, asserting that the joint resolution merely recognized that Indiana had already joined the Union by forming a state constitution and government on June 29, 1816. These representatives pointed out that both the House and Senate had seated members from Indiana who had been elected prior to the joint resolution, which would have been unconstitutional had Indiana not been a state at the time of their election. Representative Samuel D. Ingham then moved that the question be postponed indefinitely. The House agreed almost unanimously, and the Senate was brought back in to count the electoral votes from Indiana. The issue had no bearing on the final result.
Results
When the votes were counted, Monroe had won all but three of the nineteen states. King thought that a Monroe victory was inevitable, and did not seriously contest the election.[6]
Each of the three states that were won by King voted for a different person for vice president. Massachusetts electors voted for former United States Senator (and future Governor) John Eager Howard of Maryland. Delaware chose a different Marylander, sitting United States Senator Robert Goodloe Harper. Connecticut split its vote between James Ross of Pennsylvania and Chief Justice John Marshall.
Maryland did not choose its electors as a slate; rather, it divided itself into electoral districts, with each district choosing one elector. Three of Maryland's eleven districts were won by Federalist electors. However, these electors did not vote for King or for a Federalist vice president, instead casting blank votes as a protest.[of what?][citation needed]
| Presidential candidate | Party | Home state | Popular vote(a), (b) | Electoral vote(c) |
Running mate | |||
|---|---|---|---|---|---|---|---|---|
| Count | Percentage | Vice-presidential candidate | Home state | Electoral vote(c) | ||||
| James Monroe | Democratic-Republican | Virginia | 93,871 | 72.9% | 183 | Daniel D. Tompkins | New York | 183 |
| Rufus King | Federalist | New York | 16,983 | 13.2% | 34 | John E. Howard | Maryland | 22 |
| James Ross | Pennsylvania | 5 | ||||||
| John Marshall | Virginia | 4 | ||||||
| Robert Goodloe Harper | Maryland | 3 | ||||||
| Unpledged electors | None | N/A | 17,997 | 14.0% | 0 | N/A | N/A | 0 |
| Total | 128,851 | 100% | 217 | 217 | ||||
| Needed to win | 109 | 109 | ||||||
Source (Popular Vote): A New Nation Votes: American Election Returns 1787-1825[7]
(a) Only 10 of the 19 states chose electors by popular vote.
(b) Those states that did choose electors by popular vote had widely varying restrictions on suffrage via property requirements.
(c) One Elector from Delaware and three Electors from Maryland did not vote.
Maps
-
Map of presidential election results by county, shaded according to the vote share of the highest result for an elector of any given candidate
-
Map of presidential election results by electoral district, shaded according to the vote share of the highest result for an elector of any given candidate. Electoral boundaries for Maryland and most of Tennessee could not be found
Results by state
Elections in this period were vastly different from modern day presidential elections. The actual presidential candidates were rarely mentioned on tickets and voters were voting for particular electors who were pledged to a particular candidate. There was sometimes confusion as to who the particular elector was actually pledged to. Results are reported as the highest result for an elector for any given candidate. For example, if three Monroe electors received 100, 50, and 25 votes, Monroe would be recorded as having 100 votes. Confusion surrounding the way results are reported may lead to discrepancies between the sum of all state results and national results.
The Federalist parties of New Jersey, Rhode Island, and Pennsylvania did not provide a slate of electors, and as such Monroe was virtually unopposed in most of these states (with the exception of Federalist unpledged electors who received a handful of votes).[8][9][10] In Pennsylvania, the federalist supported Monroe electors with opposition coming from an independent ticket of unpledged electors.[10]
Voters in Tennessee cast ballots, but they have been lost to time.[11]
| James Monroe
Democratic-Republican |
Rufus King
Federalist |
Other | Margin | Not cast | Citation | |||||||||
|---|---|---|---|---|---|---|---|---|---|---|---|---|---|---|
| State | Electoral vote | # | % | Electoral vote | # | % | Electoral vote | # | % | Electoral vote | # | % | # | |
| Connecticut | 9 | no popular vote | 0 | no popular vote | 9 | no popular vote | 0 | no popular vote | - | |||||
| Delaware | 4 | no popular vote | 0 | no popular vote | 3 | no popular vote | 0 | no popular vote | 1 | |||||
| Georgia | 8 | no popular vote | 8 | no popular vote | 0 | no popular vote | 0 | no popular vote | - | |||||
| Indiana | 3 | no popular vote | 3 | no popular vote | 0 | no popular vote | 0 | no popular vote | - | |||||
| Kentucky | 12 | 1,864+ | 100% | 12 | no ballots | 0 | no ballots | 0 | 1,864 | 100% | - | [12] | ||
| Louisiana | 3 | no popular vote | 3 | no popular vote | 0 | no popular vote | 0 | no popular vote | - | |||||
| Maryland | 11 | 7,426 | 70.72% | 8 | 3,048 | 29.03% | - | 26 | 0.25% | 0 | 4,352 | 41.44% | 3 | [13] |
| Massachusetts | 22 | no popular vote | 0 | no popular vote | 22 | no popular vote | 0 | no popular vote | - | |||||
| New Hampshire | 8 | 15,225 | 53.17% | 8 | 13,338 | 46.58% | 0 | 74 | 0.26% | 0 | 1,813 | 6.33% | - | [14] |
| New Jersey | 8 | 5,441 | 97.46% | 8 | no ballots | 0 | 142 | 2.54% | 0 | 5,299 | 94.92% | - | [8] | |
| New York | 29 | no popular vote | 29 | no popular vote | 0 | no popular vote | 0 | no popular vote | - | |||||
| North Carolina | 15 | 9,549 | 98.37% | 15 | no ballots | 0 | 158 | 1.63% | 0 | 9,391 | 96.74% | - | [15] | |
| Ohio | 8 | 3,326 | 84.87% | 8 | 593 | 15.13% | 0 | no ballots | 0 | 2,733 | 69.74% | - | [16] | |
| Pennsylvania | 25 | 42,945 | 70.93% | 25 | no ballots | 0 | 17,597 | 29.07% | 0 | 25,348 | 52.28% | - | [10] | |
| Rhode Island | 4 | 1,236+ | 100% | 4 | no ballots | 0 | no ballots | 0 | 1,236 | 100% | - | [9] | ||
| South Carolina | 11 | no popular vote | 11 | no popular vote | 0 | no popular vote | 0 | no popular vote | - | |||||
| Tennessee | 8 | no data | 100% | 8 | no ballots | 0 | no ballots | 0 | no data | - | [11] | |||
| Vermont | 8 | no popular vote | 8 | no popular vote | 0 | no popular vote | 0 | no popular vote | - | |||||
| Virginia | 25 | 6,859 | 99.94% | 25 | 4 | 0.06% | 0 | no ballots | 0 | 6,855 | 99.88% | - | [17] | |
States that flipped from Federalist to Democratic-Republican
States where the margin of victory was under 10%
- New Hampshire, 6.33% (1,813 votes)
Electoral college selection
| Method of choosing electors | State(s) |
|---|---|
| Each Elector appointed by state legislature | |
| Each Elector chosen by voters statewide | |
| State is divided into three electoral districts, with four Electors chosen per district by the voters of each district | |
| State is divided into electoral districts, with one Elector chosen per district by the voters of that district |
See also
- First inauguration of James Monroe
- History of the United States (1789-1849)
- 1816–17 United States House of Representatives elections
- 1816–17 United States Senate elections
References
- ^ "National General Election VEP Turnout Rates, 1789-Present". United States Election Project. CQ Press.
- ^ William DeGregorio, The Complete Book of U.S. Presidents, Gramercy 1997
- ^ National Party Conventions, 1831-1976. Congressional Quarterly. 1979.
- ^ Deskins, Donald Richard; Walton, Hanes; Puckett, Sherman (2010). Presidential Elections, 1789-2008: County, State, and National Mapping of Election Data. University of Michigan Press. pp. 65–66.
- ^ Howe 2007, p. 90.
- ^ Sabato, Larry; Ernst, Howard (January 1, 2009). Encyclopedia of American Political Parties and Elections. Infobase Publishing. pp. 304–305.
- ^ "A New Nation Votes".
- ^ a b "A New Nation Votes". elections.lib.tufts.edu. Retrieved April 27, 2020.
- ^ a b "A New Nation Votes". elections.lib.tufts.edu. Retrieved April 27, 2020.
- ^ a b c "A New Nation Votes". elections.lib.tufts.edu. Retrieved June 8, 2024.
- ^ a b "A New Nation Votes". elections.lib.tufts.edu. Retrieved April 27, 2020.
- ^ "A New Nation Votes". elections.lib.tufts.edu. Retrieved June 8, 2024.
- ^ "A New Nation Votes". elections.lib.tufts.edu. Retrieved June 8, 2024.
- ^ "A New Nation Votes". elections.lib.tufts.edu. Retrieved June 8, 2024.
- ^ "A New Nation Votes". elections.lib.tufts.edu. Retrieved June 8, 2024.
- ^ "A New Nation Votes". elections.lib.tufts.edu. Retrieved June 8, 2024.
- ^ "A New Nation Votes". elections.lib.tufts.edu. Retrieved April 27, 2020.
Works cited
- U.S. Congressional Documents
- 30 Annals of Cong. 944–949 (1817)
- Act of April 19, 1816, ch. 57, 3 Stat. 289
- Resolution of December 11, 1816, res. 1, 3 Stat. 399
- Books
- Howe, Daniel (2007). What Hath God Wrought: The Transformation of America, 1815–1848. Oxford University Press. ISBN 978-0-19-507894-7.
- Web
- "Official Name and Status History of the several States and U.S. Territories, an Explanation". The Green Papers. 2001. Retrieved December 18, 2005.
- "A Historical Analysis of the Electoral College". The Green Papers. Retrieved March 20, 2005.
Source (Electoral Vote): "Electoral College Box Scores 1789–1996". National Archives and Records Administration. Retrieved July 30, 2005.
External links
- Presidential Elections of 1816 and 1820: A Resource Guide from the Library of Congress
- A New Nation Votes: American Election Returns, 1787-1825
- Election of 1816 in Counting the Votes Archived December 22, 2019, at the Wayback Machine


