1950 Western Australian state election
Appearance
| |||||||||||||||||||||||||||||||
All 50 seats in the Western Australian Legislative Assembly 26 Assembly seats were needed for a majority | |||||||||||||||||||||||||||||||
|---|---|---|---|---|---|---|---|---|---|---|---|---|---|---|---|---|---|---|---|---|---|---|---|---|---|---|---|---|---|---|---|
| |||||||||||||||||||||||||||||||
| |||||||||||||||||||||||||||||||
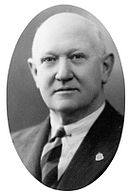
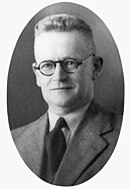
Elections were held in the state of Western Australia on 25 March 1950 to elect all 50 members to the Legislative Assembly. The Liberal-Country coalition government, led by Premier Ross McLarty, won a second term in office against the Labor Party, led by Opposition Leader Frank Wise.
The election took place after a major redistribution.
Key dates
| Date | Event |
|---|---|
| 8 February 1950 | Writs were issued by the Governor to proceed with an election.[1] |
| 17 February 1950 | Close of nominations in the North West area. |
| 3 March 1950 | Close of nominations in all other areas. |
| 25 March 1950 | Polling day, between the hours of 8am and 6pm. |
| 6 April 1950 | The McLarty–Watts Ministry was reconstituted.[2] |
| 14 April 1950 | The writ was returned and the results formally declared. |
Results
|
Western Australian state election, 25 March 1950 | ||||||
|---|---|---|---|---|---|---|
| Enrolled voters | 247,589[1] | |||||
| Votes cast | 229,298 | Turnout | 92.61% | +6.70% | ||
| Informal votes | 4,534 | Informal | 1.98% | –0.07% | ||
| Summary of votes by party | ||||||
| Party | Primary votes | % | Swing | Seats | Change | |
| Labor | 94,055 | 41.85% | 23 | ± 0 | ||
| Liberal and Country | 90,089 | 40.08% | 15 | + 2 | ||
| Country | 20,922 | 9.31% | 9 | – 3 | ||
| Ind. Lib. | 5,059 | 2.25% | 2 | + 1 | ||
| Communist | 815 | 0.36% | 0 | ± 0 | ||
| Independent | 13,824 | 6.15% | 1 | ± 0 | ||
| Total | 224,764 | 50 | ||||
- 1 306,099 electors were enrolled to vote at the election, but 12 seats (24% of the total) were uncontested—6 Labor seats (9 less than 1947) representing 26,694 enrolled voters, 2 Liberal seats (the same as 1947) representing 13,278 enrolled voters, and 4 Country seats (two more than 1947) representing 18,538 enrolled voters. This change in distribution means that comparisons in vote percentages between 1947 and 1950 are largely meaningless; they have hence been omitted from the table.
See also
- Candidates of the 1950 Western Australian state election
- Members of the Western Australian Legislative Assembly, 1947–1950
- Members of the Western Australian Legislative Assembly, 1950–1953


