Jump to content

Golzow, Potsdam-Mittelmark

Coordinates: 52°16′00″N 12°36′58″E / 52.26667°N 12.61611°E / 52.26667; 12.61611
From Wikipedia, the free encyclopedia
The printable version is no longer supported and may have rendering errors. Please update your browser bookmarks and please use the default browser print function instead.
Golzow
Location of Golzow within Potsdam-Mittelmark district
Bad BelzigBeelitzBeetzseeBeetzseeheideBensdorfBorkheideBorkwaldeBrückBuckautalGolzowGörzkeGräbenHavelseeKleinmachnowKloster LehninLintheLintheMichendorfMühlenfließNiemegkNuthetalPäwesinPlanebruchPlanetalRabensteinRosenauRoskowSchwielowseeSeddiner SeeStahnsdorfTeltowTreuenbrietzenWenzlowWerder (Havel)WiesenburgWollinWusterwitzZiesarGroß KreutzBrandenburg
Golzow is located in Germany
Golzow
Golzow
Golzow is located in Brandenburg
Golzow
Golzow
Coordinates: 52°16′00″N 12°36′58″E / 52.26667°N 12.61611°E / 52.26667; 12.61611
CountryGermany
StateBrandenburg
DistrictPotsdam-Mittelmark
Municipal assoc.Brück
Subdivisions5 Ortsteile
Government
 • Mayor (2024–29) Ralf Werner[1]
Area
 • Total
39.97 km2 (15.43 sq mi)
Elevation
42 m (138 ft)
Population
 (2022-12-31)[2]
 • Total
1,405
 • Density35/km2 (91/sq mi)
Time zoneUTC+01:00 (CET)
 • Summer (DST)UTC+02:00 (CEST)
Postal codes
14778
Dialling codes033835
Vehicle registrationPM
Websitewww.amt-brueck.de

Golzow is a municipality in the Potsdam-Mittelmark district, in Brandenburg, Germany.

Within the municipality is a large forest, the Golzower Busch.

Demography
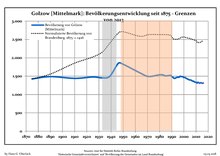
Development of Population since 1875 within the Current Boundaries (Blue Line: Population; Dotted Line: Comparison to Population Development of Brandenburg state; Grey Background: Time of Nazi rule; Red Background: Time of Communist rule)
Golzow [Mittelmark]: Population development
within the current boundaries (2013)[3]
YearPop.±% p.a.
1875 1,426—    
1890 1,488+0.28%
1910 1,441−0.16%
1925 1,478+0.17%
1933 1,453−0.21%
1939 1,498+0.51%
1946 1,852+3.08%
1950 1,824−0.38%
1964 1,587−0.99%
1971 1,492−0.88%
1981 1,541+0.32%
1985 1,509−0.52%
1989 1,522+0.21%
1990 1,487−2.30%
1991 1,469−1.21%
1992 1,441−1.91%
1993 1,448+0.49%
1994 1,465+1.17%
1995 1,472+0.48%
1996 1,471−0.07%
YearPop.±% p.a.
1997 1,499+1.90%
1998 1,487−0.80%
1999 1,488+0.07%
2000 1,463−1.68%
2001 1,464+0.07%
2002 1,439−1.71%
2003 1,424−1.04%
2004 1,406−1.26%
2005 1,398−0.57%
2006 1,390−0.57%
2007 1,369−1.51%
2008 1,361−0.58%
2009 1,339−1.62%
2010 1,334−0.37%
2011 1,331−0.22%
2012 1,331+0.00%
2013 1,306−1.88%
2014 1,324+1.38%
2015 1,307−1.28%
2016 1,313+0.46%

References

  1. ^ Landkreis Potsdam-Mittelmark Wahl der Bürgermeisterin / des Bürgermeisters. Retrieved 10 July 2024.
  2. ^ "Bevölkerungsentwicklung und Bevölkerungsstandim Land Brandenburg Dezember 2022" (PDF). Amt für Statistik Berlin-Brandenburg (in German). June 2023.
  3. ^ Detailed data sources are to be found in the Wikimedia Commons.Population Projection Brandenburg at Wikimedia Commons