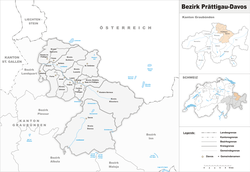
Prättigau/Davos District
Appearance
(Redirected from Prattigau/Davos (district))
Prättigau/Davos District
Bezirk Prättigau/Davos | |
|---|---|
District | |
 | |
| Country | |
| Canton | |
| Capital | Davos |
| Area | |
• Total | 853.40 km2 (329.50 sq mi) |
| Population (December 2015) | |
• Total | 26,257 |
| • Density | 31/km2 (80/sq mi) |
| Time zone | UTC+1 (CET) |
| • Summer (DST) | UTC+2 (CEST) |
| Municipalities | 13 |
Prättigau/Davos District (German: Bezirk Prättigau/Davos, Romansh: ) is a former administrative district in the canton of Graubünden, Switzerland. It had an area of 823.95 km2 (318.13 sq mi) and has a population of 26,257 in 2015. It was replaced with the Prättigau/Davos Region on 1 January 2017 as part of a reorganization of the Canton.[1]
It consists of seven Kreise (sub-districts) and fifteen municipalities:
| Municipality | Population (31 December 2020)[2] |
Area (km²) |
|---|---|---|
| Davos | 10,832 | 254.48 |
| Municipality | Population (31 December 2020)[2] |
Area (km²) |
|---|---|---|
| Fideris | 595 | 25.32 |
| Furna | 207 | 33.25 |
| Jenaz | 1,147 | 25.95 |
| Municipality | Population (31 December 2020)[2] |
Area (km²) |
|---|---|---|
| Klosters-Serneus | 4,416 | 193.16 |
| Municipality | Population (31 December 2020)[2] |
Area (km²) |
|---|---|---|
| Conters im Prättigau | 220 | 18.40 |
| Küblis | 891 | 8.13 |
| Municipality | Population (31 December 2020)[2] |
Area (km²) |
|---|---|---|
| Luzein | 1,596 | 31.63 |
| St. Antönien | 331 | 52.2 |
| Municipality | Population (31 December 2020)[2] |
Area (km²) |
|---|---|---|
| Grüsch | 2,115 | 43.30 |
| Schiers | 2,727 | 61.75 |
| Municipality | Population (31 December 2020)[2] |
Area (km²) |
|---|---|---|
| Seewis im Prättigau | 1,376 | 49.64 |
The sub-districts Davos, Jenaz, Klosters, Küblis and Luzein belonged until 1986 to the defunct district Oberlandquart; the sub-districts Schiers and Seewis to the defunct district Unterlandquart.
Mergers
On 1 January 2016 the former municipality of Saas im Prättigau merged into Klosters-Serneus.[3]
Languages
| Languages | Census 2000 | |
|---|---|---|
| Number | Percent | |
| German | 23,492 | 89.9% |
| Romansh | 285 | 1.1% |
| Italian | 452 | 1.7% |
| TOTAL | 26,130 | 100% |
References
- ^ Swiss Federal Statistical Office - Amtliches Gemeindeverzeichnis der Schweiz - Mutationsmeldungen 2016 accessed 16 February 2017
- ^ a b c d e f g "Ständige und nichtständige Wohnbevölkerung nach institutionellen Gliederungen, Geburtsort und Staatsangehörigkeit". bfs.admin.ch (in German). Swiss Federal Statistical Office - STAT-TAB. 31 December 2020. Retrieved 21 September 2021.
- ^ Amtliches Gemeindeverzeichnis der Schweiz (in German) accessed 18 January 2018
