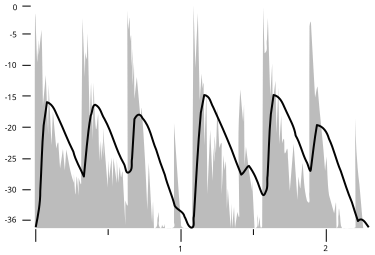
File:VU-meter-reponse-graph.svg
Appearance

Size of this PNG preview of this SVG file: 375 × 255 pixels. Other resolutions: 320 × 218 pixels | 640 × 435 pixels | 1,024 × 696 pixels | 1,280 × 870 pixels | 2,560 × 1,741 pixels.
Original file (SVG file, nominally 375 × 255 pixels, file size: 21 KB)
File history
Click on a date/time to view the file as it appeared at that time.
| Date/Time | Thumbnail | Dimensions | User | Comment | |
|---|---|---|---|---|---|
| current | 01:33, 9 July 2006 |  | 375 × 255 (21 KB) | Iainf | {{Information |Description= Graph showing the reponse of a VU meter (black line) compared to instantanous level (grey area). Level is in dB, time frame is in seconds. |Source= My own work |Date= 2006-07-09 |Author= ~~~~ |Permission= my own work |other_ver |
File usage
The following 3 pages use this file:
