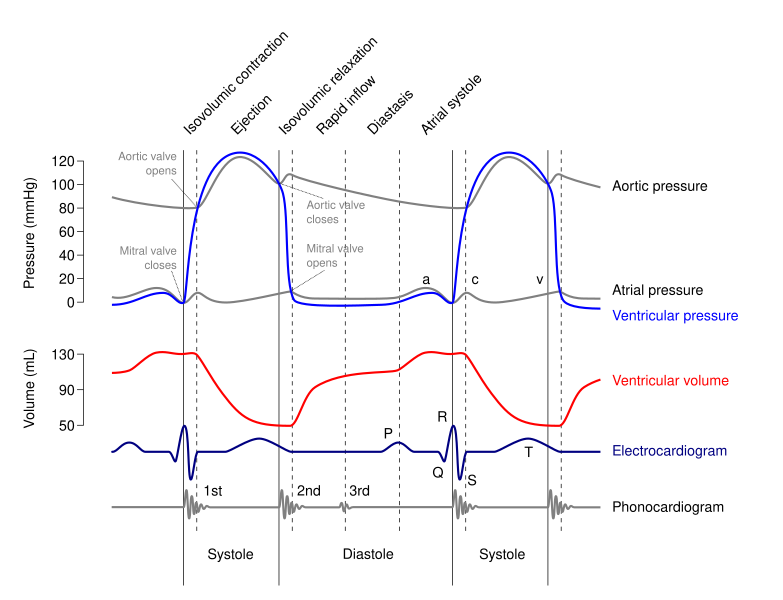
Archivo:Wiggers Diagram.svg
Apariencia

Tamaño de esta previsualización PNG del archivo SVG: 783 × 600 píxeles. Otras resoluciones: 313 × 240 píxeles · 627 × 480 píxeles · 1003 × 768 píxeles · 1280 × 980 píxeles · 2560 × 1961 píxeles · 1098 × 841 píxeles.
Ver la imagen en su resolución original ((Imagen SVG, nominalmente 1098 × 841 pixels, tamaño de archivo: 36 kB))
Historial del archivo
Haz clic sobre una fecha y hora para ver el archivo tal como apareció en ese momento.
| Fecha y hora | Miniatura | Dimensiones | Usuario | Comentario | |
|---|---|---|---|---|---|
| actual | 03:06 2 ago 2021 |  | 1098 × 841 (36 kB) | Yerachmiel C | File uploaded using svgtranslate tool (https://svgtranslate.toolforge.org/). Added translation for lv. |
| 03:02 2 ago 2021 |  | 1098 × 841 (36 kB) | Yerachmiel C | File uploaded using svgtranslate tool (https://svgtranslate.toolforge.org/). Added translation for lv. | |
| 17:56 21 mar 2012 |  | 1098 × 841 (21 kB) | Xavax | Code reduced | |
| 19:38 20 mar 2012 |  | 1053 × 841 (30 kB) | Xavax | some corrections: text, colors and positons of text objects | |
| 12:56 20 mar 2012 |  | 1053 × 841 (29 kB) | Xavax | now 200% | |
| 11:27 20 mar 2012 |  | 528 × 421 (30 kB) | Xavax | =={{int:filedesc}}== {{Information |description={{en|1=A Wiggers diagram, showing the cardiac cycle events occuring in the left ventricle. In the atrial pressure plot: wave "a" corresponds to atrial contraction, wave "c" corresponds to an increase in... | |
| 11:19 20 mar 2012 |  | 528 × 421 (32 kB) | Xavax | =={{int:filedesc}}== {{Information |description={{en|1=A Wiggers diagram, showing the cardiac cycle events occuring in the left ventricle. In the atrial pressure plot: wave "a" corresponds to atrial contraction, wave "c" corresponds to an increase in... | |
| 11:16 20 mar 2012 |  | 528 × 421 (31 kB) | Xavax | =={{int:filedesc}}== {{Information |description={{en|1=A Wiggers diagram, showing the cardiac cycle events occuring in the left ventricle. In the atrial pressure plot: wave "a" corresponds to atrial contraction, wave "c" corresponds to an increase in... | |
| 11:12 20 mar 2012 |  | 528 × 421 (31 kB) | Xavax | =={{int:filedesc}}== {{Information |description={{en|1=A Wiggers diagram, showing the cardiac cycle events occuring in the left ventricle. In the atrial pressure plot: wave "a" corresponds to atrial contraction, wave "c" corresponds to an increase in... | |
| 11:10 20 mar 2012 |  | 528 × 421 (29 kB) | Xavax | =={{int:filedesc}}== {{Information |description={{en|1=A Wiggers diagram, showing the cardiac cycle events occuring in the left ventricle. In the atrial pressure plot: wave "a" corresponds to atrial contraction, wave "c" corresponds to an increase in... |
Usos del archivo
Las siguientes páginas usan este archivo:
Uso global del archivo
Las wikis siguientes utilizan este archivo:
- Uso en ar.wikipedia.org
- Uso en bn.wikipedia.org
- Uso en ca.wikipedia.org
- Uso en ceb.wikipedia.org
- Uso en de.wikipedia.org
- Uso en el.wikipedia.org
- Uso en en.wikipedia.org
- Uso en en.wikibooks.org
- Uso en fa.wikipedia.org
- Uso en fr.wikipedia.org
- Uso en ga.wikipedia.org
- Uso en ja.wikipedia.org
- Uso en ko.wikipedia.org
- Uso en lv.wikipedia.org
- Uso en ml.wikipedia.org
- Uso en nl.wikipedia.org
- Uso en ru.wikipedia.org
- Uso en sr.wikipedia.org
- Uso en sv.wikipedia.org
- Uso en th.wikipedia.org
- Uso en tr.wikipedia.org
- Uso en zh.wikipedia.org


