Перейти на страницу файла на Викискладе

Файл:Content of Tweets.svg

Материал из Википедии — свободной энциклопедии
Перейти к навигации Перейти к поиску

Исходный файл (SVG-файл, номинально 400 × 400 пкс, размер файла: 3 КБ)

Описание
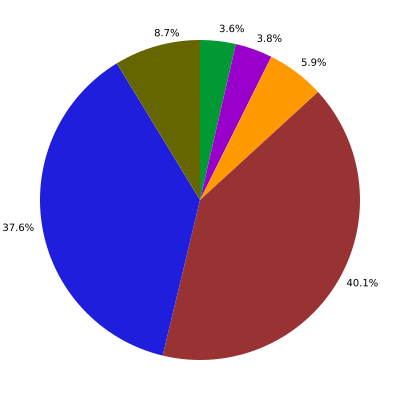
English: The content of tweets on Twitter, based on the data gathered by Pear Analytics in 2009.
Дата (UTC)
Источник
Автор
Я, владелец авторских прав на это произведение, добровольно публикую его на условиях следующей лицензии:
Public domain Я, владелец авторских прав на это произведение, передаю его в общественное достояние. Это разрешение действует по всему миру.
В некоторых странах это не может быть возможно юридически, в таком случае:
Я даю право кому угодно использовать данное произведение в любых целях без каких-либо условий, за исключением таких условий, которые требуются по закону.

Key

 
News
3.990%
 
Spam
3.75%
 
Self-promotion
5.86%
 
Pointless babble
40.54%
 
Conversational
37.55%
 
Pass-along value
8.70%

Source

Kelly, Ryan, ed. (2009-08-12), "Twitter Study - August 2009" (PDF), Twitter Study Reveals Interesting Results About Usage, San Antonio, Texas: Pair Analytics. https://pearanalytics.com/wp-content/uploads/2012/12/Twitter-Study-August-2009.pdf

Исходный журнал загрузок

This image is a derivative work of the following images:

  • File:Content_of_tweets_pie_chart.png licensed with PD-self
    • 2009-11-11T21:43:50Z ReinforcedReinforcements 600x463 (31045 Bytes) Reverted to version as of 21:35, 11 November 2009
    • 2009-11-11T21:42:23Z ReinforcedReinforcements 600x463 (31045 Bytes) Made the slices of the graph much more easy to understand, they are all different colors rather than different shades of the same color.
    • 2009-11-11T21:35:54Z ReinforcedReinforcements 600x463 (31045 Bytes) Made the slices of the graph much more easy to understand, they are all different colors rather than different shades of the same color.
    • 2009-10-07T07:05:47Z Quillaja 779x625 (69171 Bytes) {{Information |Description={{en|1=A pie chart created in Excel 2007 showing the content of tweets on Twitter, based on the data gathered by Pear Analytics in 2009.}} |Source={{own}} |Author=[[User:Quillaja|Quillaja]] |Date=20

Uploaded with derivativeFX

Краткие подписи

Добавьте однострочное описание того, что собой представляет этот файл

Элементы, изображённые на этом файле

изображённый объект

17 сентября 2010

image/svg+xml

400 пиксель

400 пиксель

История файла

Нажмите на дату/время, чтобы посмотреть файл, который был загружен в тот момент.

Дата/времяМиниатюраРазмерыУчастникПримечание
текущий12:43, 21 сентября 2010Миниатюра для версии от 12:43, 21 сентября 2010400 × 400 (3 КБ)Bryan.burgersChanged the font to DejaVu Sans.
13:05, 17 сентября 2010Миниатюра для версии от 13:05, 17 сентября 2010400 × 400 (3 КБ)Bryan.burgersWikimedia's SVG renderer doesn't support centered text, so I had to change where the text appeared to not overlap the pie slices.
12:59, 17 сентября 2010Миниатюра для версии от 12:59, 17 сентября 2010400 × 400 (3 КБ)Bryan.burgers{{Information |Description={{en|1=The content of tweets on Twitter, based on the data gathered by Pear Analytics in 2009.}} |Source=*File:Content_of_tweets_pie_chart.png |Date=2010-09-17 12:53 (UTC) |Author=*[[:File:Content_of_tweets_pie_chart.png|]

Нет страниц, использующих этот файл.

Глобальное использование файла

Данный файл используется в следующих вики:

Метаданные